Earth's Water
Earth's water distribution C. M. Glee Nov. 26, 2011
Wikipedia earth's water distribution https://en.wikipedia.org/ wiki/Water_distribution_on_ Earth#/media/File: Earth_water_distribution.svg CC BY-SA 3.0
Earth's water is stored and located above and below Earth's surface, and in the atmosphere.
More than 99% is contained in oceans, seas and bays, with small amounts in lakes, rivers and streams, with even smaller amounts hidden as
permafrostthick subsurface layer of soil that remains frozen throughout the year, usually in polar regions
and
as water vapor in the atmosphere.
Changes in water location, availability, temperature, purity and
salinitythe degree to which something is salty
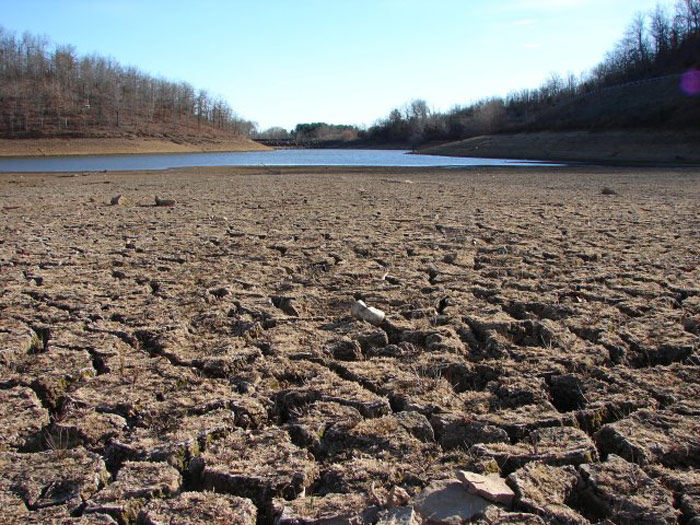
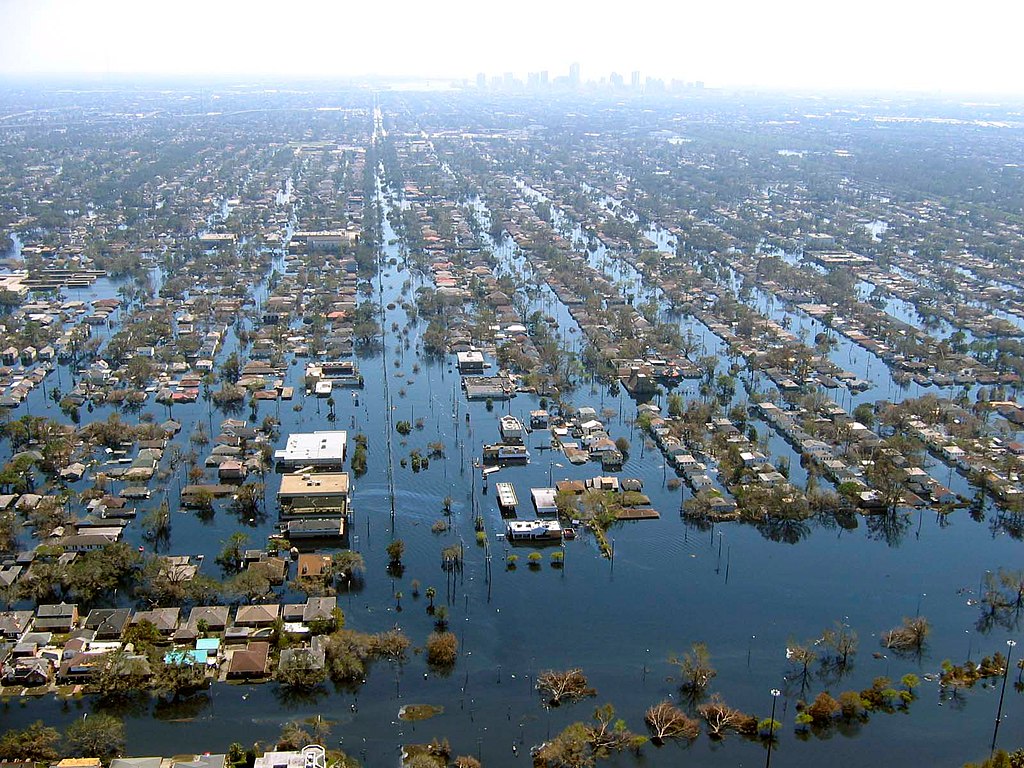
can produce additional climate and weather changes, flooding, droughts, disruption in the natural balances of plants and animal species and the spread of diseases.
If all of Earth's water, located in oceans, icecaps and glaciers, lakes, rivers, groundwater and water in the atmosphere, were put into a sphere,
the diameter of that water ball would be about 860 miles (about 1,385 km), a little more than the distance between Salt Lake City, Utah and Topeka, Kansas.
The volume of all water would be about 332.5 miles3, or 1,386 km3.[1]
A mile3 of water equals more than 1.1 trillion gallons.
A km3 of water equals about 264 billion gallons, or 1 trillion liters.[1]
About 3,100 mile3 (12,900 km3) of water, mostly in the form of water vapor, is in the atmosphere.
If it all fell as precipitation at once, the Earth would be covered with only about 1 inch of water.[1]
Each day, the lower 48 U.S. states receive a total volume of about 4 mile3 (17.7 km3) of precipitation
and 280 mile3 (1,170 km3) of water evaporate or transpire into the atmosphere.[1]
If all of the world's water was poured on the contiguous U.S. states, it would cover the land to a depth of about 107 miles (145 km).[1]
Of the fresh water on Earth, more is stored in the ground than is available in rivers and lakes.
More than 2,000,000 mile3 (8,400,000 km3) of fresh water is stored in the Earth, most within one-half mile of the surface.
Most fresh water is stored in the 7,000,000 mile3 (29,200,000 km3) of glaciers and icecaps in the polar regions and in Greenland.[1]
Sources:
[1]
USGS. (n. d.). How much water is there on Earth?
https://www.usgs.gov/special-topics/ water-science-school/science/how-much-water-there-earth#:~:text=About%2071%20percent%20of%20the,Water%20is%20never%20sitting%20still.
Ice Sheets
An ice sheet forms through snowfall accumulation, when annual snowfall exceeds annual snowmelt.
Snow layers build up for thousands of years, creating a flowing ice sheet thousands of meters thick.
Increasing snow height puts pressure on the layers below, which deform and spread out in all directions.[1]
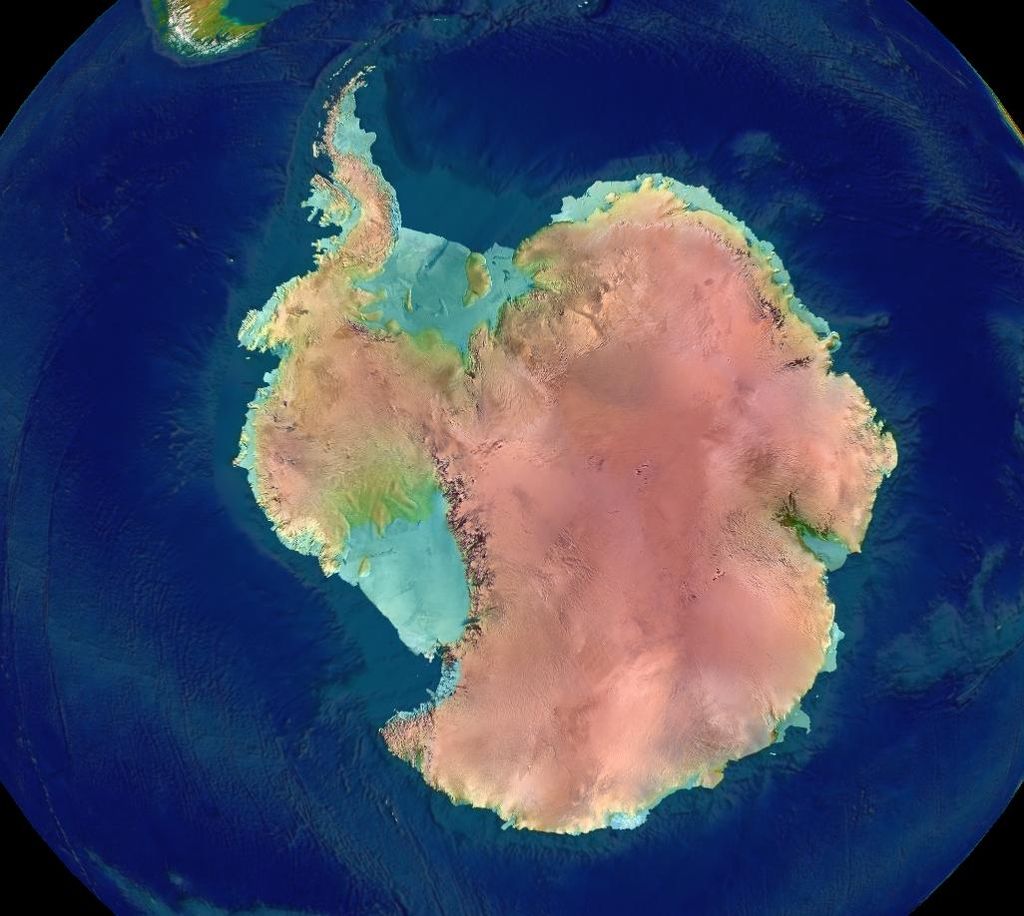
Earth's two
ice sheetsa mass of glacial land ice extending more than 50,000 square kilometers (20,000 square miles)
cover most of Greenland and Antarctica.
They contain more than 99% of Earth's fresh water ice.[1]
Antarctica NASA Oct. 5, 2006
Wikipedia Antarctica https://en.wikipedia.org/ wiki/Polar_ice_cap#/media/ File:Antarctica_6400px_ from_Blue_Marble.jpg public domain
Greenland and Antarctica Ice Sheets[2]➔
location
surface area in km2
volume in km3
description
sea level rise in m if melted
Antarctica
14 million
30 million
approximately the size of United States and Mexico combined
60
Greenland
1.7 million
310,410,900
three times the size of Texas
6
Due to increased carbon emissions and global warming they are now melting six times faster than in the 1990s,
the worst-case climate warming scenario set out by the
Intergovernmental Panel on Climate Change (IPCC).
In the near future melting ice could produce a sea level rise that could leave 400 million people living near coasts subject to major flooding.[3]
Average annual Greenland and Antarctica ice loss in the 2010s was 475 billion tons, six times greater than the 81 billion tons lost each year during the 1990s.
Between 1992 and 2017, the two ice caps lost 6.4 trillion tons of ice, 60% from Greenland, and the remaining 40% from Antarctica.[3]
In 2022, Greenland experienced its largest September melting event, due to global warming.
The first day of September marks the end of the Greenland melt season, as the Sun appears to move lower in the sky, causing decreasing temperatures.[4]
But warm air moved over
Baffin Bay,
Baffin Bay
Connormah Jun. 12, 2009
Wikipedia Baffin Bay https://en.wikipedia.org/ wiki/Baffin_Bay#/media/ File:Baffin_Bay,_Canada.svg
CC BY-SA 3.0
resulting in tens of billions of tons of lost ice.
Parts of western Greenland experienced 35oF (20oC) temperatures.
About 35% of the ice was affected, far above the usual 10% for September.
During the event, Greenland may have lost about 20 billion tons of ice, about 7% of the annual total ice loss.[4]
Milne fjord and surrounding land NASA Aug. 15, 2006
Wikipedia Milne land https://en.wikipedia.org/ wiki/Milne_Land#/media/ File:Milne_Land_NASA.jpg public domain
Meltwater runoff rates were as high as 12 billion tons per day, one of the top ten largest runoff events on record.
If it refreezes, it creates ice sheets that prevent meltwater from percolating through snowpack, contributing to sea level rise.
For every 360 billion tons of ice lost, sea level rises about 1 millimeter.
Greenland is the largest contributor to that rise.[4]
Milne Fjord is a research station about 500 miles from the North Pole.
It sits on the coast of a site called the Last Ice Area, a 400,000-square-mile region north of Greenland and the Canadian Arctic Archipelago, between ice floes.
Its
epishelf lakea freshwater lake which is dammed by an ice shelf, with a layer of freshwater floating on saltier marine water
has now disappeared, due to global warming.[6]
In the past, scientists found four liquid lakes below the Greenland ice sheet, but 50 more have recently been located.
There are about 470 lakes beneath Antarctica.
The largest,
Lake Vostok,
Satellite view of Lake Vostok
Goddard Spaceflight Center/NASA May 23, 2005
Wikipedia Lake Vostok https://en.wikipedia.org/ wiki/Lake_Vostok#/media/ File:Lake_Vostok_Sat_Photo_color.jpg public domain
is 250 kilometers long.
The biggest subglacial lake under Greenland is only 6 kilometers in length.[5]
Water pools under ice sheets due to ice pressure from above and geothermal heat from below which keeps the water in liquid form.
Melting surface water also drains into subsurface lakes.[5]
Scientists study these lakes and their interaction with the ice sheets to determine how they are affected by global warming and how they will contribute to rising sea levels.[5]
If all of Greenland's ice melts, it will increase global ocean height by 7 meters.[5]
Melting ice sheets are also contributing to
polar drift,a geological phenomenon caused by variations in the flow of molten iron in Earth's outer core resulting in orientation changes of its magnetic field and position of the magnetic north and south poles
which reversed its direction in 1995.
By 2020 polar movement increased about 17 times compared to the average speed measured between 1981 and 1995 due to water loss from polar regions.[7]
North pole drift Cavit Feb. 6, 2016
Wikipedia polar drift https://en.wikipedia.org/wiki/ Polar_drift#/media/File:Magnetic _North_Pole_Positions_2015.svg CC BY 4.0
Sources:
[1]
National Snow & Ice Data Center. (n. d.). State of the cryosphere: Ice sheets.
https://nsidc.org/cryosphere/sotc/ice_sheets.html
[2]
National Snow & Ice Data Center. (n. d.). Quick facts on ice sheets.
https://nsidc.org/cryosphere/quickfacts/icesheets.html
[3]
Carrington, D. (Mar. 11, 2020). Polar ice caps melting six times faster than in 1990s. The Guardian.
https://www.theguardian.com/environment/2020/mar/11/ polar-ice-caps-melting-six-times-faster-than-in-1990s
[4]
Patel, K., & Mooney, C. (Sep. 6, 2022). For first time on record, Greenland saw extensive melting in September. The Washington Post.
https://www.washingtonpost.com/climate-environment/ 2022/09/06/greenland-ice-melt-heat-wave-summer/
[5]
Amos, J. (Jun. 26, 2019). Greenland ice sheet: 'More than 50 hidden lakes' detected. BBC.
https://www.bbc.com/news/science-environment-48773778
[6]
Nunn, A. S. (Feb. 10, 2023). The 'last ice area' is already disappearing. Grist.
https://grist.org/science/ last-ice-area-disappearing-arctic-lake-permafrost-thaw-science/
[7]
Bartels, M. (Apr. 22, 2021). Climate change has altered the Earth's tilt. Space.com.
https://www.space.com/climate-change-tilting-earth-axis
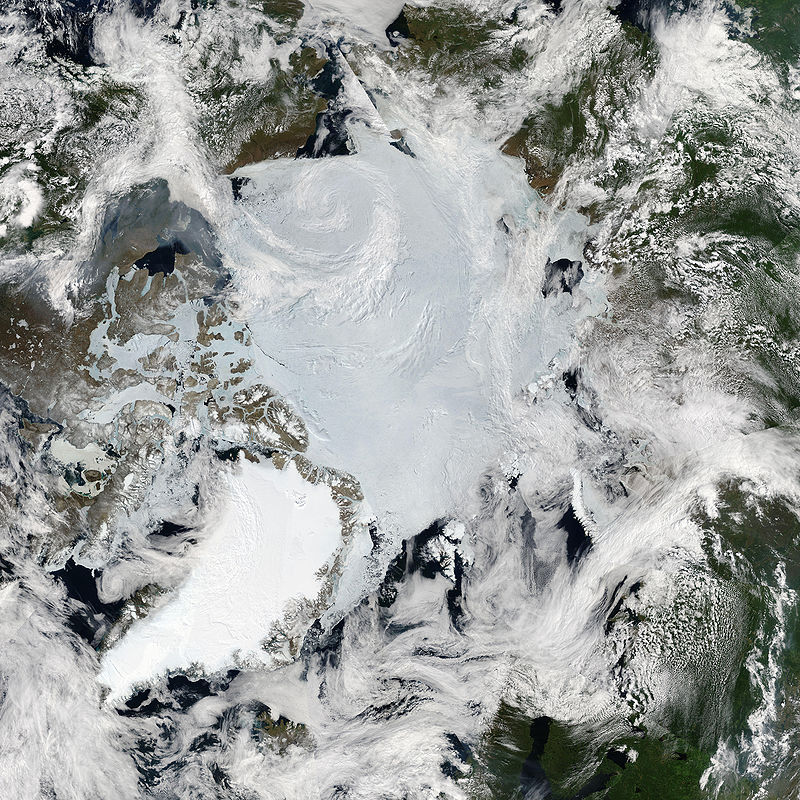
Arctic Region
The Arctic is defined as the area within the Arctic Circle, a line of latitude about 66.5o north of the Equator.
Within this circle are the Arctic ocean basin, the northern parts of Scandinavia, Russia, Canada, Greenland, Alaska, glaciers and icebergs,
which make up about 20% of Earth's fresh water.[2]
Most of the Arctic consists of liquid saltwater of the Arctic ocean basin.
Some parts of the ocean's surface remain frozen all year as sea ice which may be covered in snow.
Sea ice affects Earth's climate by reflecting about 80% of the light that strikes it.[2]
Arctic population S. Harder, Arctic Council Jan. 1, 2009
Wikipedia Arctic https://en.wikipedia.org/ wiki/Arctic#/media/File: Circumpolar_coastal_human_ population_distribution_ca._2009.png public domain
Following sunset on the September
equinox,when the Sun appears directly above the equator, rising due east and setting due west, around March 20 and September 23
the Earth's
axial tiltthe 23o tilt of Earth's axis relative to the plane of its orbit around the Sun
and
revolutionrefers to Earth's orbit around the Sun of approximately 365 days, 6 hours, 9 minutes
around the sun reduce the light and heat reaching the Arctic
until no sunlight penetrates the darkness.[2]
The sun rises again during the March equinox and increases the light and heat reaching the Arctic.
By the June
solsticeoccurs when the Sun appears to reach its most northerly, around June 21, or southerly, around December 21, positions relative to the celestial equator
on the celestial sphere
the Arctic experiences 24 hours of daylight.[2]
The Arctic includes the Bering, Beaufort and Chukchi seas, and sea ice, coastal wetlands, upland
tundra,a vast, flat, treeless Arctic region of Europe, Asia and North America in which the subsoil is permanently frozen
mountains, wide rivers.
About 4 million people from several cultures live in the Arctic, parts of which belong to 8 different countries.[1]
Frozen Arctic soil holds about 1,460 to 1,600 billion tons of trapped carbon, about twice the amount in the atmosphere.[3]
Greenhouse gases from fossil fuel burning is causing temperatures in the Arctic to warm at twice the rate of the rest of the world.[2]
Methanea powerful greenhouse gas and the simplest hydrocarbon, consisting of one carbon atom and four hydrogen atoms
and carbon are found in Arctic
permafrost,thick subsurface layer of soil that remains frozen throughout the year, usually in polar regions
frozen peat bogs and under sea floor sediment.
As they thaw, methane and carbon are released into the atmosphere, adding more global greenhouse gases and global warming.
More warming results in more permafrost loss and more atmospheric greenhouse gases.[3]
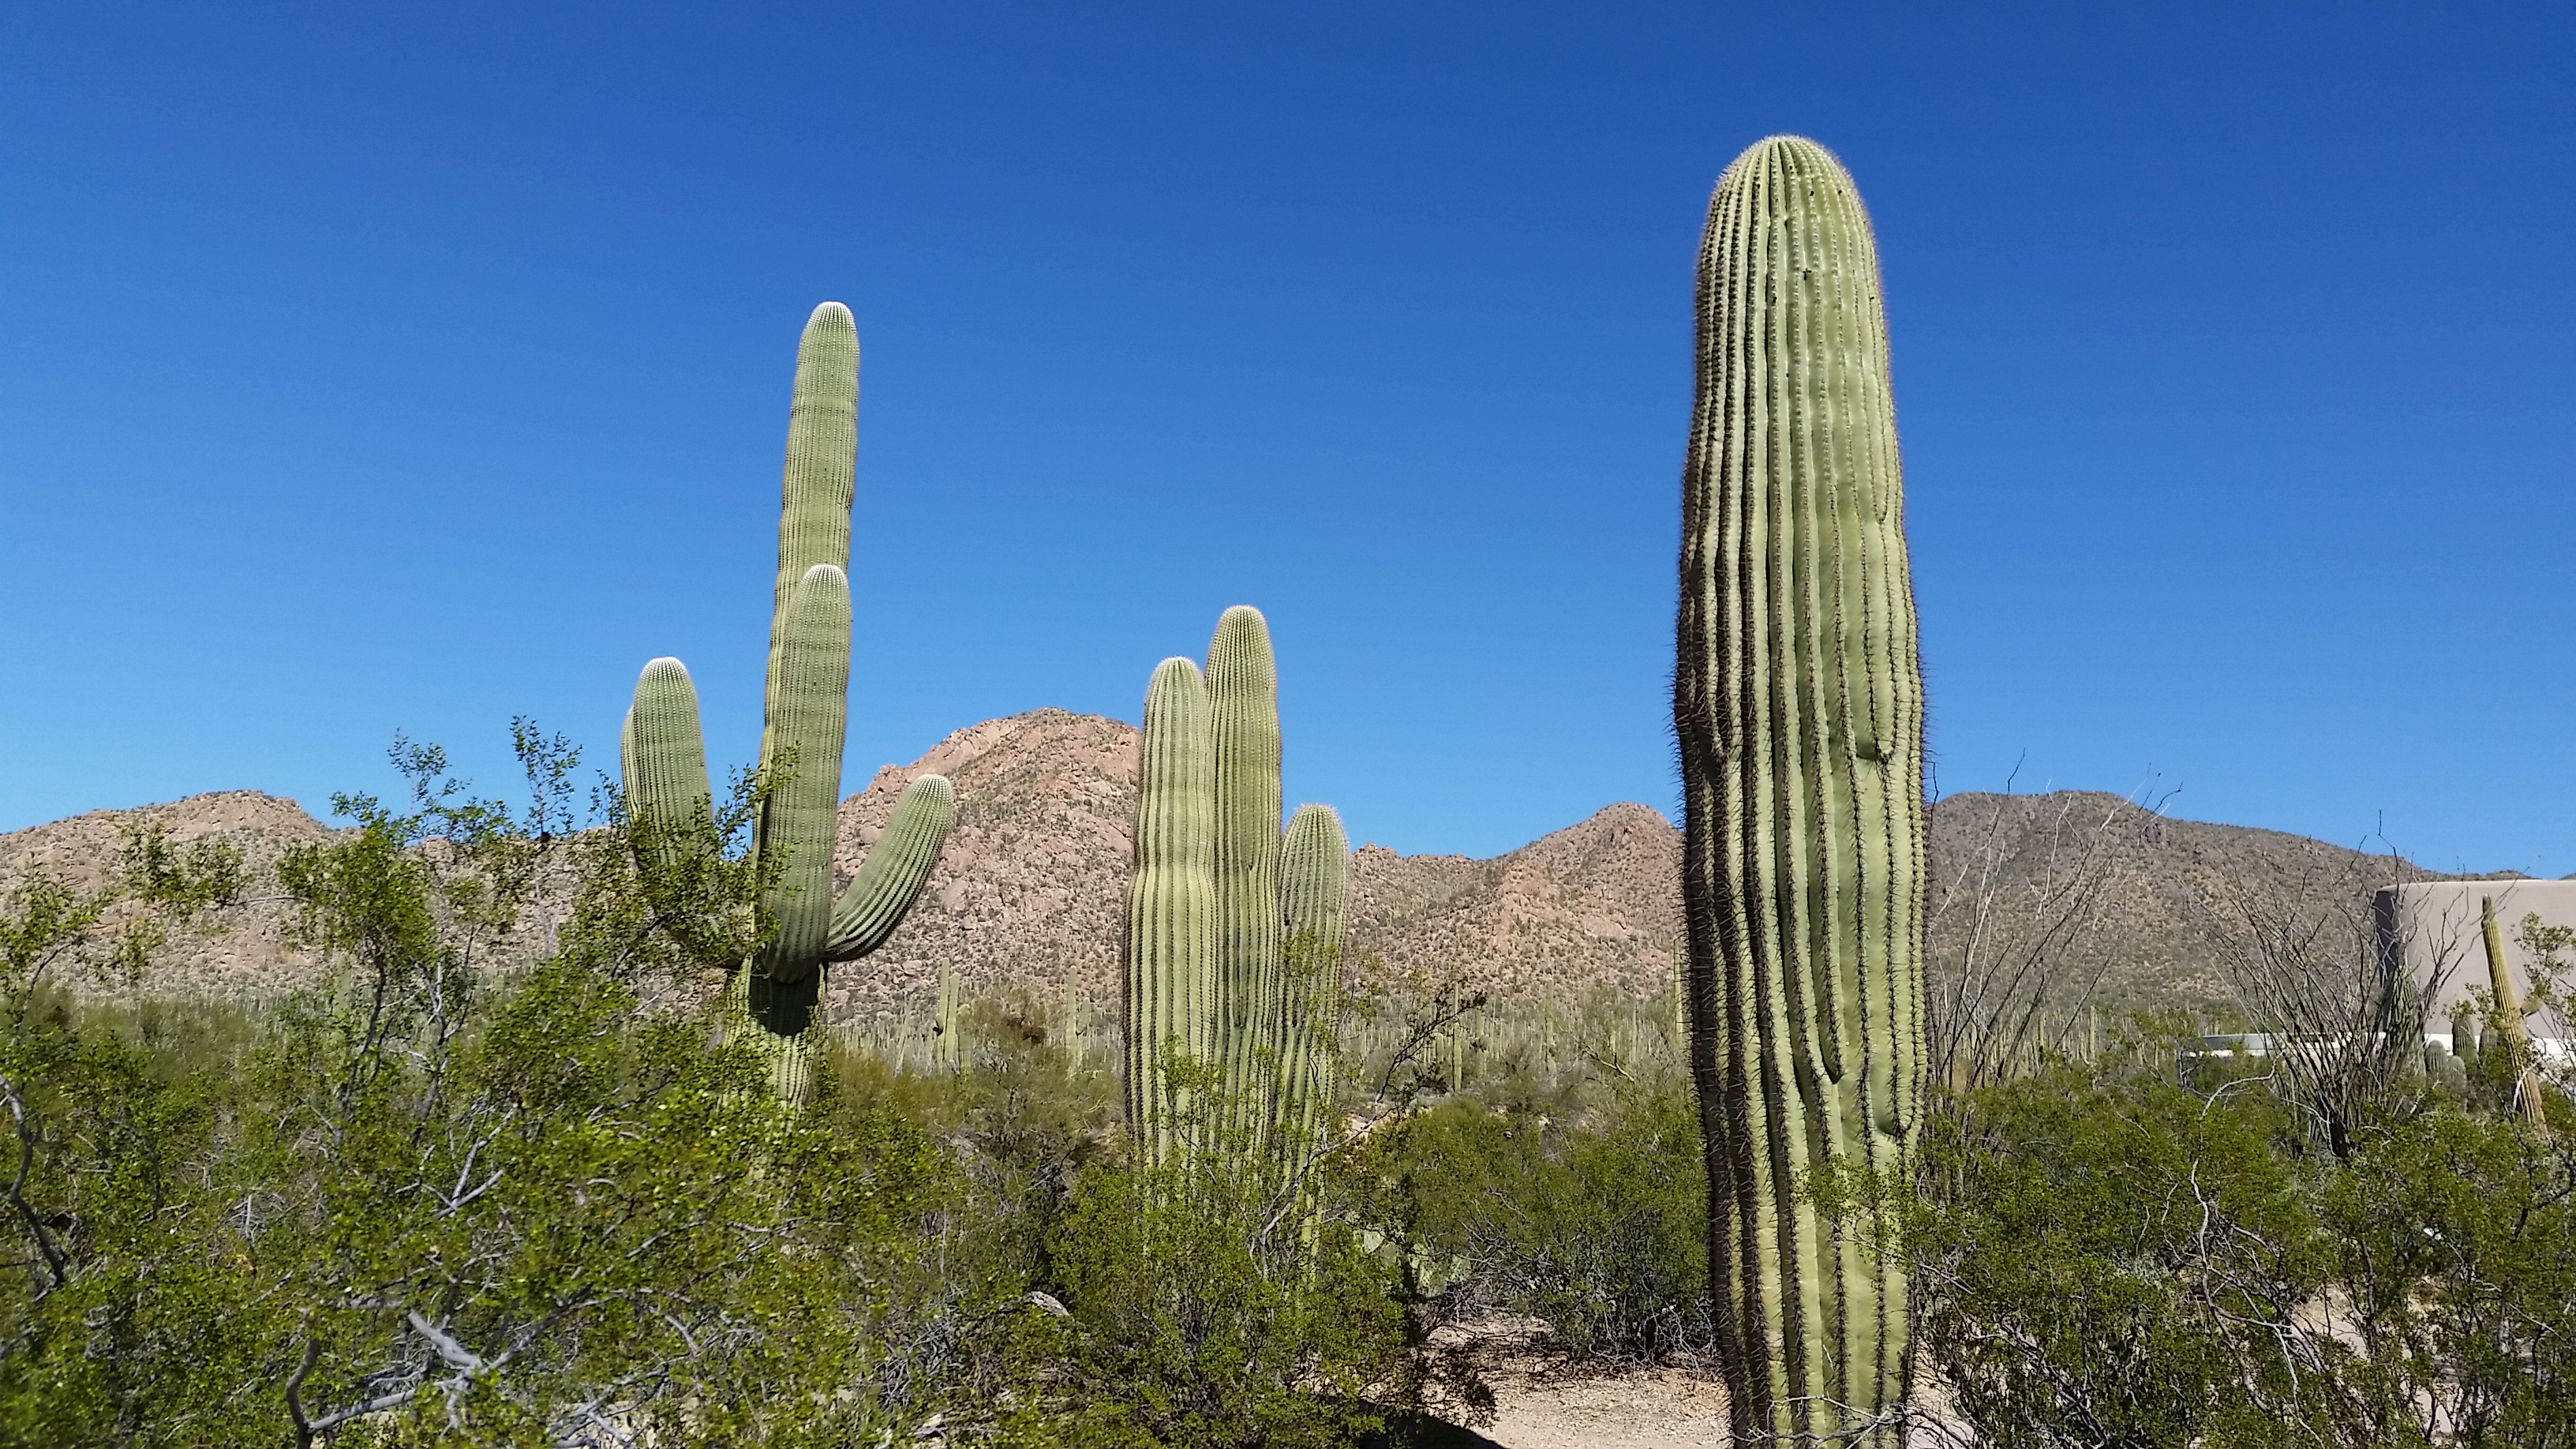
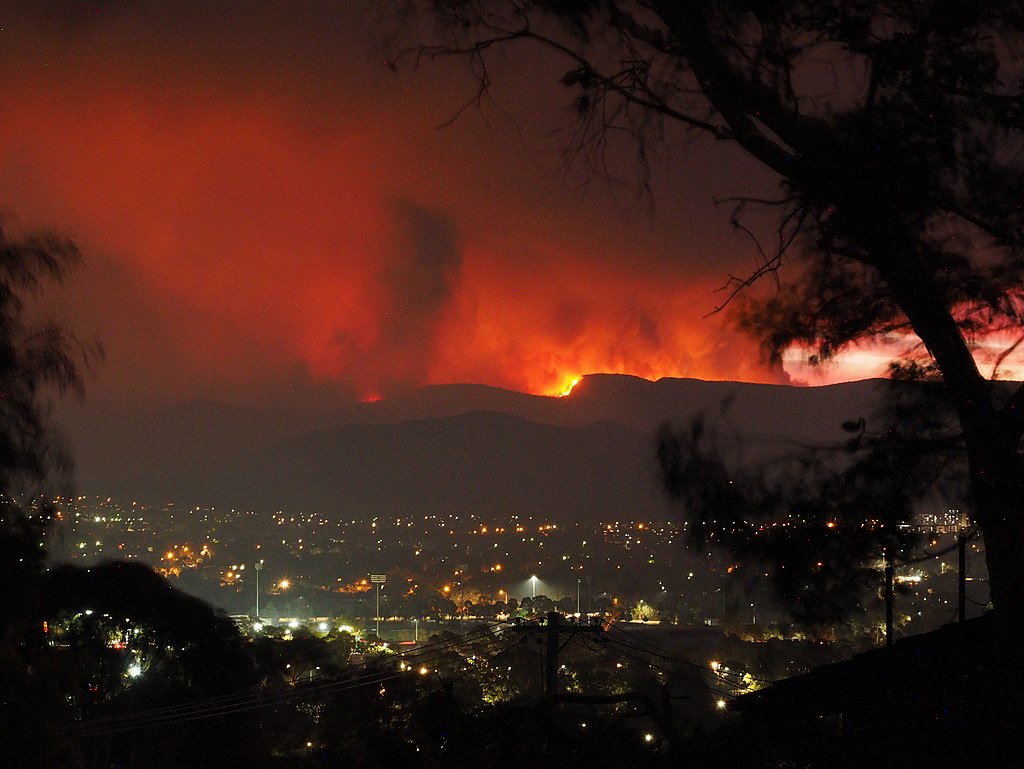
What happens in the Arctic has an effect on wildfires in the western U.S.
Ice loss causes land and sea surface warming, resulting in hotter and drier summers subjected to fire-related conditions.[4]
Arctic Ocean ice helps regulate global land and sea temperatures.
White sea ice reflects about 50 to 70% of solar radiation, preventing Earth from getting warmer.[3]
But Arctic sea ice is shrinking.
While the lowest amount ever recorded was in 2012, 2022 Arctic sea ice extent was tied with 2007 and 2016 for the second-lowest minimum on record.
An NOAA report concluded that Arctic sea ice shrunk by 40% since 1979.[3]
In 2022 heat waves across Europe from May to August killed more than 60,000 people.
The United Kingdom reported its first-ever 40oC temperature.
The European Union's second-worst wildfire season burned about 3,500 square miles of land.
[5]
In the summer of 2023 warmth over Greenland melted ice, pushing freshwater toward the North Atlantic, which will cause heatwaves and droughts in
Northern Europe during the next five years, which may create conditions worse than those in 2022.[5]
Disappearing sea ice also exposes the darker ocean surface.
The ocean reflects only 6% of solar radiation, absorbing the rest and warming water and surrounding atmosphere.
The disappearance of this ice is moving toward an irreversible tipping point.
Within the next 20 to 25 years, there may be no sea ice in September in the Arctic.[3]
Perennial Arctic Sea ice decline 1984-2016 SciNews Oct. 29, 2016
YouTube https://www.youtube.com/watch?v=VIxciS1B9eo Embedded video, no copy made
Fossil fuels also increase the acidity of Arctic water, harming
zooplankton,plankton consisting of small animals and the immature stages of larger animals
which are the base of the Arctic food chain.[1]
The decrease in volume and extent of Arctic sea ice has serious implications for the habitat of
polar and brown bears, several whale species, ringed seals, Arctic wolves, Pacific salmon, porpoises and dolphins that live on Arctic land and the surrounding sea.[2]
The reduction in sea ice has warmed Alaska's climate, accelerated coastal erosion, reduced walrus and other marine mammal habitat,
changed the timing and location of microscopic plant life and lowered survival rates for some fish species.[3]
Sources:
[1]
World Wildlife Fund. (2022). Arctic.
https://www.worldwildlife.org/places/arctic
[2]
National Geographic Society. (2022). The Arctic.
https://www.nationalgeographic.org/encyclopedia/arctic/
What is the world`s second largest ice sheet?
[3]
The Climate Reality Project. (n. d.). How feedback loops are making the climate crisis worse.
https://www.climaterealityproject.org/blog/how-feedback-loops-are-making-climate-crisis-worse
[4]
Berwyn, B. (Jul. 27, 2022). Wildfire pollution may play a surprising role in the fate of Arctic sea ice. Inside Climate News.
https://insideclimatenews.org/news/27072022/wildfire-pollution-may-play-a-surprising-role-in-the-fate-of-arctic-sea-ice/#:~:text=Scientists%20say%20changes%20in%20the,will%20disappear%20completely%20in%20summer.
[5]
Berwyn, B. (Mar. 1, 2024). Study pinpoints links between melting Arctic ice and summertime extreme weather in Europe. Inside Climate News.
https://insideclimatenews.org/news/01032024/links-between-melting-arctic-ice-and-summertime-extreme-weather-in-europe/?utm_source=InsideClimate+News&utm_campaign=426613cb86-EMAIL_CAMPAIGN_2024_03_02_02_00&utm_medium=email&utm_term=0_29c928ffb5-426613cb86-327955973
Antarctic Region
Antarctica NASA Jan. 1, 2009
Wikipedia Antarctica https://en.wikipedia.org/ wiki/Antarctica#/media/ File:Antarctica.svg public domain
With about 98% of its land covered by ice, Antarctica is the highest, driest, windiest, coldest and iciest continent.
It is about about 5.5 million square miles (14.2 million square km).
It is divided into East Antarctica, composed of a high ice-covered plateau, and West Antarctica, an ice sheet covering a mountainous
archipelagoan area that contains a chain or group of islands scattered in lakes, rivers or the ocean[1]
The ice sheet contains approximately 7 million cubic miles (about 29 million cubic km) of ice, representing about 90% of the world's ice and
80% of its fresh water.
Its average thickness is about 5,900 feet (1,800 m).[1]
Ice shelves cover parts of the Ross and Weddell seas.
The Ross Ice Shelf, the Filchner-Ronne Ice Shelf and other continental margin shelves create the border of about 45% of the continent.
Around the coast, shelves, glaciers and ice sheets release icebergs into the seas.[1]
Scientific investigation began during the
1957-58 International Geophysical Year (IGY).
On December 1, 1959, the 12 countries active in Antarctica during the IGY signed the Antarctic Treaty,
preserving the continent for nonmilitary scientific pursuits and placing Antarctica under an international regime binding
members to review of its provisions after 30 years.
The treaty placed the boundary at 60o south latitude.[1]
The 1991 Madrid Protocol prohibited mining, required environmental impact assessments for new activities, and designated the continent as a natural reserve.[1]
Scientists have mapped the continent's mountain regions, and until the 1970s relied on ground-based seismic surveys to find mountain ranges and peaks.
Airborne
radio-echo sounding systemsa transmitter and receiver system that sends out radio waves and detects those waves bounced from objects
now measure ice-thickness, facilitating systematic surveys.[1]
An underwater robot called Icefin deployed beneath the Thwaites ice shelf and confirmed that it is one of the least stable ice shelves in Antarctica.
Researchers estimate that its collapse could lead to a two-foot rise in sea level over the next few centuries.
Thwaites contributes about 4% to current overall rate of global sea level rise, about 1.5 inches per decade.[2]
Why are massive ocean currents slowing down? Australian Academy of Sciences Mar. 29, 2023
YouTube https://www.youtube.com/watch?v=-KlpKq3YEdM Embedded video, no copy made
Antarctic waters are warming because of climate change.
As warmer water flows beneath the ice shelf, it melts, thinning and weakening the shelf.
Its
grounding linethe region where ice transitions from a grounded ice sheet to freely floating ice shelf
has moved inland about 8 miles over the past two decades.[2]
Fresh water melting ice could slow currents by as much as 40% in the next 30 years by reducing ocean salinity.
Slower currents deliver less oxygen, carbon dioxide and nutrients to the world's marine ecosystem and
warmer water can't absorb as much atmospheric carbon dioxide as in the past.[3]
Deeper and warmer water creates a
positive environmental feedback loop.accelerates an environmental response, such as increasing ice melting rates or raising global temperatures
More melting releases more fresh water into the oceans, affecting rainfall and agriculture.[3]
The world's largest iceberg, A23a, is three times the size of New York City, was grounded in the Weddell Sea, until it began moving in December 2023
into the Southern Ocean. The iceberg calved from the Filchner Ice Shelf in 1986.
The iceberg may provide nutrients to its surrounding waters and thriving ecosystems.[4]
Icebergs may provide a new source of drinking water.
Candidate icebergs can be identified using satellite maps, secured with cranes or nets, ground and hacked into smaller pieces and transported.
Relocating icebergs could damage their effectiveness at sequestering CO2, require a lot of energy to move them and
affect the warmer waters where the cold bergs are relocated.[5]
In South Africa drinking water is desperately needed.
One proposed solution is dragging an iceberg 2,000 miles from Antarctica to provide a fresh water source while preventing it from melting.[5]
Sources:
[1]
van der Watt, L. (May 20, 2022). Antarctica. Encyclopedia Britannica.
https://www.britannica.com/place/Antarctica
[2]
Fountain, H. (Feb. 15, 2023). Scientists get a close-up look beneath a troubling ice shelf in Antarctica. The New York Times.
https://www.nytimes.com/2023/02/15/climate/thwaites-antarctica-melting-robot.html?campaign_id=54&emc=edit_clim_20230217&instance_id=85616&nl= climate-forward®i_id=75304528&segment_ id=125584&te=1&user_id=41c41844ba6d41e6e92a0dd7bae484d3
What mountain range`s snow feeds the Amazon River?
[3]
Myers, K. (Apr. 3, 2023). Melting Antarctic ice may strangle vital ocean currents. Grist.
https://grist.org/climate/melting-antarctic-ice-may-strangle-vital-ocean-currents/
[4]
Rice, D. (Dec. 4, 2023). Caught on camera! The world's biggest iceberg, a megaberg, 3 times size of New York City. USA Today.
https://www.usatoday.com/story/news/nation/2023/12/04/worlds-largest-iceberg-megaberg-photos-antarctica/71801378007/#:~:text=Caught%20on%20camera!,size%20of%20New%20York%20City&text=It's%20so%20big%2C%20scientists%20are,got%20an%20up%2Dclose%20look.
[5]
Chawaga, P. (Jan. 2, 2024). The latest solution to global drought means wrangling icebergs themselves. Water Online.
https://www.wateronline.com/doc/the-latest-solution-to-global-drought-means-wrangling-icebergs-themselves-0001
Glaciers
Pakistan's Baltoro Glacier is one of the world's longest alpine glaciers G. Vellut Oct. 23, 2005
Wikipedia glacier https://en.wikipedia.org/ wiki/Glacier#/media/File: Baltoro_glacier_from_air.jpg CC BY-SA 2.0
Glaciers, made from compressed snow that develops into thick ice masses, have been melting since the early 1900s and
95% of the oldest and thickest ice in the Arctic has disappeared.[5]
Unlike ice sheets, which flow in all directions, glaciers flow like rivers, usually due to gravity.
Glacier sizes range from a few hundreds of meters to hundreds of kilometers in length.[1]
About 10% of Earth's surface is covered by glaciers, most of which are located in Antarctica, Greenland, and the Canadian Arctic.
Most glaciers were formed during the
Little Ice Ageclimate cooling period that occurred from the early 14th century through the mid-19th century,
when mountain glaciers expanded at several locations, including the European Alps, New Zealand, Alaska, and the southern Andes,
and mean annual temperatures across the Northern Hemisphere declined by 0.6Co
when ice covered about 32% of Earth's land area, and 30% of the oceans.[1]
There are several types of glaciers:
calving,a glacier that ends in a body of water into which it drops icebergs
cirque,a small glacier that forms in a basin high on the side of a mountain
hanging,a glacier that begins high on a glacier valley wall and descends only part of the way to the surface of the main glacier
piedmont,a fan or lobe-shaped glacier, located at the front of a mountain range
polar,a glacier in which ice temperatures always remain below the freezing point
reconstituteda glacier formed below the bottom of a hanging glacier by the accumulation, and reconstitution by pressure melting of ice blocks that have fallenor avalanched from the end of the hanging glacier
rock,a glacier-like landform that consists of a valley-filling accumulation of angular rock blocks, has little or no visible surface ice
temperate,a glacier in which liquid water coexists with glacier ice during part or even all of the year
tidewatera glacier that ends in a body of water influenced by tides, such as the ocean or a large lake
and
valley.a glacier that flows for all or most of its length within the walls of a mountain valley, also called an alpine glacier or a mountain glacier[2]
Glacier facts:
glacial ice often appears blue when it has become dense and bubble-free due to compression
white glacial ice indicates trapped air bubbles
the
Bering glacier
Bering glacier
NASA Sep. 29, 2002
Wikipedia Bering glacier https://en.wikipedia.org/ wiki/Bering_Glacier#/media/ File:Bering_glacier.jpg public domain
in Alaska, measuring 190 kilometers is North America's longest glacier
the record for the fastest glacial surge belongs to
Kutiah Lungma glacier
Kutiah Lungma glacier
A. Rizmi Aug. 16, 2012
Wikipedia Kutiah Lungma glacier https://en.wikipedia.org/ wiki/Kutiah_Lungma_Glacier#/media/ File:Kutia_Lungma_Glacier.jpgCC BY-SA 4.0
in Pakistan which moved more than 12 kilometers in three months during 1953
Washington state has more glaciers than any other U.S. state, and they provide 1.8 trillion liters (470 billion gallons) of water every summer
the world's largest glacier is the
Lambert glacier Lambert glacier
NASA/USGS Dec. 2, 2000
Wikipedia Lambert glacier https://en.wikipedia.org/ wiki/Lambert_Glacier#/media/ File:Icefall_hires_2.jpg public domain
in Antarctica, which is 400 kilometers (250 miles) long, and up to 100 kilometers (60 miles) wide.[3]
Perito Moreno glacier, Patagonia, Argentina L. Galuzzi Mar. 22, 2005
Wikipedia glacier https://en.wikipedia.org/ wiki/Glacier#/media/File: Perito_Moreno_Glacier_Patagonia _Argentina_Luca_Galuzzi_2005.JPG CC BY-SA 2.5
Global warming is having a significant effect on Earth's glaciers:
the snows of
Kilimanjaro Kilimanjaro
Chris 73 Mar. 16, 2007
Wikipedia Kilimanjaro https://en.wikipedia.org/ wiki/Mount_Kilimanjaro#/media/ File:Mt._Kilimanjaro_12.2006.JPG
CC BY-SA 3.0
have melted more than 80 percent since 1912
glaciers in the Garhwal Himalaya in India are retreating so fast that researchers believe that most central and eastern Himalayan glaciers could virtually disappear by 2035
spring fresh water ice breakup in the Northern Hemisphere now occurs nine days earlier than it did 150 years ago, and autumn freeze-up ten days later
thawing permafrost has caused the ground to subside more than 15 feet (4.6 meters) in parts of Alaska
glaciers from the Arctic to Peru, from Switzerland to the equatorial Man Jaya in Indonesia, are quickly disappearing[4]
between November 2018 and May 2021 Antarctica's Cadman glacier completely collapsed[9]
a 2023 Portland State University glacier study found that 52 of the 612 officially named glaciers in the U.S. no longer exist because they are now too small to qualify or have completely disappeared.[10]
The number of glacial lake outburst floodsa flood caused by the failure of a dam containing a glacial lake
has increased significantly since 1990, affecting nearly 15 million people.
About 1 million residents of High Mountains Asia live within 10 kilometers of a glacial lake, with more than half living in India, Pakistan, Peru and China.[7]
While white snow is Earth's most reflective surface, pink algae, found at high altitudes on glaciers, forms what scientists call watermelon snow.
This pink snow absorbs heat, forcing snow to melt quickly, leaving large pools of red water.
Scientists are studying how this algae, Chlamydomonas nivalis, affects seasonal water supplies and its potential impact on flooding and how climate change
may alter the algal growth.[6]
Ice Memory Sanctuary in Antarctica: Where will we store the ice cores? Ice Memory Foundation Jan. 30, 2023
YouTube https://www.youtube.com/watch?v=rDJ2FrDsG1k Embedded video, no copy made
Svalbard, Norway
Svalbard, Norway European Space Agency/Copernicus Sentinel-2 Mission Oct. 28, 2022
Wikipedia Svalbard, Norway https://en.wikipedia.org/wiki/ Svalbard#/media/File: Svalbard_ESA24544704.jpeg public domain
is the world's most northern settlement.
Its Arctic glaciers are melting more than twice as fast as other Arctic glaciers and more than five times faster than the rest of the planet.
As glaciers melt they release methane, created by shale and coal, which produce more warming.[8]
During the last century glacial retreat caused trapped groundwater to bubble to the surface.
Researchers discovered that the methane concentration in this water was 600,000 times higher than in non-glacial sources.[8]
Glaciers provide thousands of years of Earth climate and atmospheric data.
Preserving glacial cores for study by future generations of scientists is critical in understanding the degrees to which
anthropomorphic and natural forces affect climate change.
Concordia Station is located at an altitude of 3,233 m on the High Antarctic Plateau, 1,100 km from the nearest coast and 2,500 km from the geographic South Pole.
With an average temperature of -54oC, it is an ideal environment for the protection of glacial ice core climate records located in the
Ice Memory Sanctuary.[11]
The Sanctuary's unique principles require that:
heritage should be owned by humanity, not by a nation, individual or organization
the center will transfer to an international organization in 20 years to ensure governance for the future
cores must be available to scientists in the future only on scientific criteria and impact for humanity and not on geopolitical criteria.[11]
Watermelon snow on Mount Ritter in California Pacific Southwest Forest Service/P. Wade Aug. 29, 2017
Wikipedia watermelon snow https://en.wikipedia.org /wiki/Watermelon_snow#/media/File: 170828-FS-Inyo-PRW-001-Mount Ritter_(36217539154).jpg public domain
Sources:
[1]
National Snow & Ice Data Center. (n. d.). What is a glacier?
https://nsidc.org/cryosphere/glaciers/questions/what.html
[2]
USGS. (n. d.). Glossary of glacier terminology.
https://pubs.usgs.gov/of/2004/1216/text.html
[3]
National Snow & Ice Data Center. (n. d.). Glacier quick facts.
https://nsidc.org/cryosphere/glaciers/quickfacts.html
[4]
Glick, D. (n. d.). The big thaw. National Geographic.
https://www.nationalgeographic.com/environment/global-warming/big-thaw/
[5]
World Wildlife Foundation. (2022). Why are glaciers and sea ice melting?
https://www.worldwildlife.org/pages/why-are-glaciers-and-sea-ice-melting#: ~:text=Human%20activities%20are%20at%20the,sea%20and%20 retreating%20on%20land.
[6]
Mohr, K. (Nov. 29, 2022). Pink snow is a red flag for the West's water. High Country News.
https://www.hcn.org/issues/54.12/north-water-pink-snow-is-a-red-flag-for-the-wests-water
[7]
Taylor, C., et al. (2023). Glacial lake outburst floods threaten millions globally. Nature Communications, 14(487).
https://www.nature.com/articles/s41467-023-36033-x
[8]
Larsen, L. (Jul. 6, 2023). The melting glaciers of Svalbard offer an ominous glimpse of more warming to come. Inside Climate News.
https://insideclimatenews.org/news/06072023/svalbard-melting-glaciers-climate-change/
[9]
Waldek, S. (Nov. 29, 2023). This Antarctic glacier dramatically retreated. Then, its ice shelf totally collapsed. Space.com.
https://www.space.com/satellites-cadman-glacier-antarctica-retreat-ice-shelf-collapse
[10]
Drew, M. (Nov. 25, 2023). New study details shrinking, vanishing glaciers across lower 48. Flathead Beacon.
https://flatheadbeacon.com/2023/11/25/new-study-details-shrinking-vanishing-glaciers-across-lower-48/#:~:text=New%20Study%20Details%20Shrinking%2C%20Vanishing%20Glaciers%20Across%20Lower%2048,-A%20new%20comprehensive&text=Six%20named%20snow%20features%20in,in%20Earth%20System%20Science%20Data.
[11]
Ice Memory Foundation. (Mar. 7, 2024). Sanctuary in Antarctica.
https://www.ice-memory.org/sanctuary-in-antarctica/
Oceans, Seas, Currents
Earth has 5 major oceans:
Pacifichome to the Mariana trench, the deepest oceanic trench on Earth, measuring about 2,550 kilometers (1,580 miles) in length and 69 kilometers (43 miles) in width.[1],
Atlanticthe breakup of Pangaea created the Atlantic Ocean[2],
Indianthe smallest and geographically youngest ocean[3],
Southernwater cooled by cold air, outgoing radiation, and katabatic winds off of the Antarctic continent sinks and flows northward along the ocean bottom and replaced at the surface by warmer water flowing south from the Indian, Pacific, and Atlantic oceans[4]
and
Arcticalmost completely circled by North America, Eurasia, and Greenland[5]
that are all part of a global ocean.
Perpetual Ocean NASA/Goddard Spaceflight Center Jul. 13, 2013
YouTube https://www.youtube.com/watch?v=87ObpUBm8BA Embedded video, no copy made
Sea level is measured using
tide stationsa device that enables sea water to enter a well that measures the water height
and
satellite laser
altimeters.an instrument that measures altitude
These measurements show that seal level is rising about an eighth of an inch per year.[17]
The Pacific contains the
Middle America trench
Middle America trench
U.S. Government Mar. 8, 2006
Wikipedia Middle America trench https://en.wikipedia.org/ wiki/Middle_America_Trench#/media/ File:MiddleAmericaTrench.jpg public domain
located off the west coast of Central Ameica.
It extends northwest-southeast for more than 1,700 miles (2,750 km) from central Mexico to Costa Rica.
The trench reaches a maximum depth of 21,880 feet (6,669 m) and covers a total area of 37,000 square miles (96,000 square km).[23]
The
Peru-Chile trench,
Peru-Chile trench
U.S. Government Mar. 7, 2006
Wikipedia Peru-Chile trench https://en.wikipedia.org/ wiki/Peru%E2%80%93Chile_Trench#/media/ File:Peru-Chile_trench.jpg public domain
also called Atacama Trench, is a submarine trench in the eastern Pacific Ocean, about 100 miles (160 km) from the Peru and Chile coast.
It reaches a maximum depth of 26,460 feet (8,065 m) below sea level in Richards Deep and is approximately 3,666 miles (5,900 km) long.
It covers about 228,000 square miles (590,000 square km).[24]
The
Mariana trench
Mariana trench
Kmusser Aug. 7, 2007
Wikipedia Mariana trench https://en.wikipedia.org/wiki/ Mariana_Trench#/media/File: Marianatrenchmap.png
CC BY 2.5
is located in the western North Pacific.[21]
It is about 35, 876 feet (10,935 m) deep, about 43 miles (69.2 km) wide[22],[28]
and was designated a U.S. national monument in 2009 to protect 18 underwater volcanoes, thermal vents and Marianas' northern islands.
The trench is home to goblin sharks, found only at the trench.[28]
Mariana islands and the Mariana trench Magalhães Feb. 11, 2006
https://en.wikipedia.org/wiki/ Mariana_Islands#/media/File: Philippine_Sea_location.jpg public domain
Friends of the Mariana Trench (FOMT) is a local, indigenous, non-profit Marianas organization that runs Project HOPE, an educational program that educates local
students about coral reefs, sea urchins, beach cleanups and ocean stewardship.[28]
More than 70% of Earth's surface is covered by water.
The deepest known ocean depth is nearly 11,000 m (36,000 feet or almost 7 miles).[11]
Scientists estimate the
hydrospherethe combined mass of water found on, under, and above Earth`s surface
contains about 1.36 billion cubic kilometers of water.
The second most common form of the water molecule on our planet is ice.
If all of Earth's ice melted, sea-level would rise by about 70 meters.[6]
Ocean currents, which can flow for thousands of kilometers, are generated by Earth's rotation, the wind,
temperature
gradients,an increase or decrease in the magnitude of a physical property
salinitythe degree to which something is salty
variations, density and the gravitational influence of the Moon.
Ocean depths, shorelines, and other currents affect current strength, direction and speed.
Currents influence climate.[7]
The
Gulf Stream,
Gulf Stream
Sommerstoffel May 24, 2006
Wikipedia Gulf Stream https://en.wikipedia.org/ wiki/Gulf_Stream#/media/ File:Golfstrom.jpg public domain
for example, makes northwest Europe much more temperate than any other region at the same latitude.[7]
Thermohalinerelating to the effects of temperature and salinity
circulation produces conveyor-belt like motion in deep ocean density-driven currents called
submarine rivers.a river-like current on the seabed [7]
Studies have suggested that one of the world's largest currents, the
Atlantic Meridional Overturning Circulation (AMOC),
Atlantic Meridional Overturning Circulation (AMOC)
C. Lee Oct. 30, 2021
Wikipedia Atlantic meridional overturning circulation https://upload.wikimedia.org/ wikipedia/commons/a/ab/ Thermohaline_circulation.svg
CC BY-SA 4.0
is slowing down due to global warming.
The AMOC helps move heat between the equator and the Arctic.
It also regulates climate and weather patterns in the Northern Hemisphere.
Some scientists have warned that this current may disappear.[12]
If the AMOC ceases operating, warm water would pile up near the East Coast instead of flowing northward.
This would contribute to extreme heat waves and more intense storms.
Winter sea ice could expand as far south as England and some European regions could dry and cool by as much as 1.5oC per decade.[32]
Ocean Quizimodo Oct. 8, 2007
Wikipedia ocean https://en.wikipedia.org/ wiki/Ocean#/media/ File:World_ocean_map.gif public domain
Earth's Oceans➔
ocean
surface area in km2
volume in km3
description
percent
Pacific
162,250,000
669,880,000
largest and deepest ocean
48.3
Atlantic
106,460,000
310,410,900
extends between Europe and Asia
22.4
Indian
70,560,000
264,000,000
world's warmest ocean, bounded by Asia on the north, Africa to the west, Australia to the east
19.0
Southern
71,800,000
20,330,000
composed of water from the South Pole to 60oS latitude
5.18
Arctic
18,750,000
14,060,000
the smallest and shallowest ocean
1.35
There are five major
gyres:large systems of rotating currents
the North and South Pacific Subtropical gyres, the North and South Atlantic Subtropical gyres, and the Indian Ocean Subtropical gyre.[9]
The 1958 Convention on the High Seas established that the high seas were open to all nations for freedom of navigation,
freedom of fishing, freedom to lay submarine cables and pipelines and freedom to fly over the high seas.
The convention also addressed safety, warships, piracy and pursuit.[26]
The 1982 Law of the Sea Convention (LOSC) established a legal framework for the use and protection of
natural and cultural resources of the sea, the seabed and subsoil and the marine environment.
The LOSC includes clear guidelines on states' navigational rights, maritime zones and boundaries and economic jurisdiction.
It also provides international cooperation and dispute resolution guidelines.
The U.S. is not a party to the LOSC but follows it.
The treaty has not obtain sufficient Congressional support needed for U.S. accession.[25]
In April 2023 a new U.N. high seas treaty was written to address rules that have failed to prevent fishery depletion, loss of fragile habitats,
decline of whale, sea turtle and bird populations and other marine life and ambiguities and lack of cooperation between entities claiming to have legal jurisdiction.
It would also establish
marine protected areas (MPAs).areas that include marine sanctuaries, estuarine research reserves, ocean parks and marine wildlife refuges[27]
What gases produce acid rain?
According to the U.S. Department of Energy ocean tides and river currents generate a small fraction of U.S. electricity today,
but have the the potential to account for about 8% of U.S. power generation in the future.[15]
The U.N. Environmental Program estimated that each year, about 11 million tons of plastic end up in the oceans.
Approximately 300 million tons of plastic waste, equal to the weight of the world's human population, are produced every year.
About 9% is recycled.
The rest accumulates in landfills and the environment.[13]
The Great Pacific Garbage Patch, about the size of Texas, is a Pacific Ocean zone between Hawaii and California with a high plastic waste concentration.
Garbage from the west coast of the U.S. and east coast of Japan is carried by the California current, the North Equatorial current, the North Pacific current,
and the Kuroshio current to the North Pacific subtropical gyre, the clockwise rotation of which draws in and traps solid matter including plastics.[8]
Ocean currents M. Pidwirny Aug. 10, 2007
Wikipedia ocean currents https://en.wikipedia.org/ wiki/Ocean_current#/media/ File:Corrientes-oceanicas.png public domain
Over time, larger pieces break into microplastics, which seep into the food chain, water systems and the atmosphere.[13]
The garbage undergoes
photodegradationdecay of material due to light exposure
causing the small pieces to break down further, into tiny, nearly invisible pieces, creating a microplastic soup.
The patch's dimensions and depth change constantly.[8]
The ocean's plastic problems have been known since the late 1980s.
In 2015 and 2016, Ocean Cleanup discovered that the garbage patch plastic density was more than expected and that the plastics absorbed pollutants,
making them poisonous to marine life.[8]
Scientists discovered that garbage patch plastics are providing a home for coastal species in the open ocean.
Some of these species, including
bryzoans,a non-moving aquatic invertebrate of the phylum Bryozoa which comprises of the moss animals
jellyfish, sponges and worms, are reproducing in their new and alien environments along with open ocean species.
Future research may determine whether these coastal and open ocean species are competing or cooperating.[19]
The International Coastal Cleanup® began more than 35 years ago, with coastal Texas community working together to collect and document coastal litter.
Local and state volunteers in the U.S. and more than 150 countries participate in a cleanup events.[14]
In March 2023 scientists found more than 13 million tons of
Sargassumbrown algae with leafy segments, air bladders or spore-bearing structures
drifting in the Atlantic Ocean.
The seaweed is washing up on beaches in southwest Florida and Mexico.[20]
Larger than usual mats were first identified in 2011.
Scientists speculate that nutrient-rich runoff from the Congo, Amazon and Mississippi Rivers is encouraging algae growth.
When Sargassum reaches the shore it decomposes, degrades water quality, pollutes beaches and produces
hydrogen sulfide.gaseous substance found in several inorganic water pollutant such as electric power waste, oil and gas extraction operations waste, sewage treatment plants, large pig farms and other confined animal feeding operations, Portland cement kilns, municipal waste landfills, coke ovens, sulfur products, asphalt production and storage and geothermal power plants[20]
Why does ice float?
Oceanic basins consist of
continental shelves,a portion of a continent that is submerged under an area of relatively shallow water
continental slopes,the slope between the outer edge of the continental shelf and the deep ocean floor
abyssal plains,an underwater plain on the deep ocean floor
abyssal hills,a hill that rises from the sea floor
seamounts,a large ocean mountain that does not rise above the sea surface
ocean trenches,a long, narrow depression in the ocean floor
volcanic islandsan island created from volcanic eruptions[10] and six zones:
epipelagic zone,the upper open ocean, where there is enough sunlight for algae to utilize photosynthesis, from the sea surface down to approximately 200 m (650 feet)
home to whales and dolphins, billfishes, tunas, jellyfishes, sharks and other creatures, algae that live in this zone are responsible for much of the
original food production for the entire ocean and create at least 50% of the oxygen in the atmosphere
mesopelagic zone,middle open ocean, from the bottom of the epipelagic to the point where sunlight can't reach,
approximately 1000 m (3300 feet) deep
the most numerous vertebrates on Earth live in this zone and migrate up into shallower, epipelagic depths to feed at night
bathypelagic zone,lower open ocean, starts at the bottom of the mesopelagic and stretches down to 4000 m (13,000 feet)
much larger than mesopelagic, 15 times the size of the epipelagic, largest Earth ecosystem,
upper bound defined by lack of sunlight, organisms live in darkness which can be interrupted by light emitted by the organisms through
bioluminescencebiochemical emission of light by living organisms such as fireflies and deep-sea fish
used to attract prey or to find a mate
End of the Great Pacific garbage patch Ocean Cleanup Jul. 21, 2022
YouTube https://www.youtube.com/watch?v=X8VOLpqCXj4 Embedded video, no copy made
abyssopelagic zone,from the bottom of the bathypelagic to the seafloor, characterized by a relative lack of life
from the bottom of the bathypelagic to the seafloor, characterized by a relative lack of life
hadopelagic zone,where deep, wide trenches occur in the flat seafloor
where deep, wide trenches occur in the flat seafloor
benthos zone,where organisms live on the ocean floor
includes
coral reefsa ridge of rock in the sea formed by the growth and deposit of coral
seagrass beds, and other systems in shallow coastal areas and
deep hydrothermal vents, the abyssal plain, and other systems in the deep sea.[11]
In March 2023 193 countries agreed on a world ocean protection treaty.
Work on the agreement began at the U.N. in 2004 and it has not been formally adopted or ratified by its individual member countries.
If ratified, the treaty will establish a new set of rules on the
high seasopen ocean that begins 200 nautical miles from a coastline and is not under the jurisdiction of the laws of any specific country
aimed at protecting marine species and the balance of its ecosystems.[16]
Territorial seas are coastal ocean waters subject to the jurisdiction of coastal nations that extend up to 12
nautical milesunit used in measuring distances at sea equal to approximately 2,025 yards or 1,852 meters
from shore.
These seas:
make up about 6% of the sea and 22 million square kilometers of territorial waters
are home to 83% of the world's coral reefs, 100% of its mangroves and sea grasses
are home to the highest concentration of biodiversity related to human needs
are used by 492 million people, about 7% of humanity
received 0.01% of global philanthropic funding in 2020.[18]
Gulf Stream current could collapse in 2025, plunging Earth into climate chaos Wonder World Jul. 25, 2023
YouTube https://www.youtube.com/watch?v=WbGopJiXxd8 Embedded video, no copy made
More than half the world's oceans have turned greener during the last two decades due to climate change.
Researchers using data from NASA's Moderate Resolution Imaging Spectroradiomete (MODIS) determined that greening can be explained by increased
plankton and algae carbon dioxide absorption.
Oceans absorb about 25% of Earth's carbon emissions, but may not be able to absorb more in the future.[29]
The planet's average sea surface temperature spiked to a record high in April 2023 and has remained high.
In July 2023 widespread marine heat waves resulted in some sea surface temperatures of 100oF (38oC).
A buoy off the coast of Florida recorded a surface temperature of 101.1oF.[30]
Coral reefs are affected by overfishing, pollution and climate change.
Climate models predict that most coral reefs will experience bleaching events by 2050 if all three of these factors are not reduced.[31]
In 2023 NOAA and the International Coral Reef announcing that prolonged ocean heatwaves caused a fourth global bleaching episode,
following similar events in 1998, 2010 and 2014-2017.
Bleaching was identified in the Northern and Southern Hemisphere and across the Atlantic, Pacific and Indian oceans.[34]
Overheated oceans disrupt the relationship between corals and algae, turning reefs white.
If the water cools quickly, some corals can recover, but sustained heating is killing them.[34]
But there is some hope.
The Spermonde Archipelago, in the
Coral Triangle,
Coral Triangle O. Soul Nov. 20, 2020
Wikipedia Coral Triangle https://en.wikipedia.org/wiki/ Coral_Triangle#/media/File: Coral_Triangle_and_countries_ participating_in_the_Coral_ Triangle_Initiative.png
CC BY-SA 3.0
lies 12 miles from the coast of South Sulawesi, Indonesia.
It was the home to dynamic reefs until dynamite fishing destroyed them.
In 2018 academics, government agencies, nonprofits, and local communities began reef restoration using a
reef stara six-legged steel spider coated in sand, to which healthy coral fragments are attached.
By 2023 the fragments had grown into vibrant, colorful and healthy corals.[33]
Sources:
[1]
Cotter, C. H. (n. d.). Pacific Ocean. Encyclopedia Britannica.
https://www.britannica.com/place/Pacific-Ocean
Which continent is the driest?
[2]
LaMourie, M. J. (n. d.). Atlantic Ocean. Encyclopedia Britannica.
https://www.britannica.com/place/Atlantic-Ocean
[3]
Verlaan, P. A. (n. d.). Indian Ocean. Britannica.com.
https://www.britannica.com/place/Indian-Ocean
[4]
Editors of Encyclopedia Britannica. (n. d.). Southern Ocean. Encyclopedia Britannica.
https://www.britannica.com/place/Southern-Ocean
[5]
Ostenso, N. A. (n. d.). Arctic Ocean. Encyclopedia Britannica.
https://www.britannica.com/place/Arctic-Ocean
Ocean divisions C. Huh Aug. 16, 2006
Wikipedia abyssal plain https://en.wikipedia.org/ wiki/Abyssal_plain#/media/ File:Oceanic_divisions.svg public domain
[6]
PhysicalGeography.net. (n. d.). Physical properties of water.
http://www.physicalgeography.net/ fundamentals/8a.html
[7]
Science Daily. (n. d.). Ocean current.
https://www.sciencedaily.com/terms/ ocean_current.htm
[8]
Bauer, P. (2022). Great Pacific garbage patch. Encyclopedia Britannica.
https://www.britannica.com/science/pollution-environment
[9]
National Oceanic and Atmospheric Administration. (n. d.). What is a gyre?
https://oceanservice.noaa.gov/facts/gyre.html
[10]
National Oceanic and Atmospheric Administration. (May 1, 2020). Ocean floor features.
https://www.noaa.gov/education/resource-collections/ocean-coasts/ocean-floor-features
[11]
Oceana. (n. d.). Open oceans.
https://oceana.org/marine-life/open-ocean/ #:~:text=The%20epipelagic%20zone%20 (or%20upper,200%20m%20(650%20feet).
[12]
Harvey, C. (Mar. 8, 2022). Amazon rain forest nears dangerous 'tipping point.' Scientific American.
https://www.scientificamerican.com/article/amazon-rain-forest-nears-dangerous-tipping-point/
[13]
U.N. Environment Program. (Feb. 16, 2022). World leaders set sights on plastic pollution.
https://www.unep.org/news-and-stories/story/world-leaders-set-sights-plastic-pollution#:~:text= Every%20year%2C%20an%20estimated%2011,)%2C%20From%20 Pollution%20to%20Solution.
Ocean basins C. Huh Mar. 20, 2017
Wikipedia abyssal plain https://en.wikipedia.org/ wiki/Abyssal_plain#/media/ File:Oceanic_basin.svg public domain
[14]
Ocean Conservancy. (2022). Fighting for trash free seas. International Coastal Cleanup®
https://oceanconservancy.org/trash-free-seas/international-coastal-cleanup/
[15]
Winters, J. (Oct. 24, 2022). An untapped source of power: Rivers and tides. Grist.
https://grist.org/beacon/an-untapped-source-of-power-rivers-and-tides/
[16]
Teirstein, Z. (Mar. 6, 2023). UN reaches historic agreement to protect the world's oceans. Grist.
https://grist.org/international/un-reaches-historic-agreement-to-protect-the-worlds-oceans/?utm_medium=email&utm_source=newsletter&utm_campaign=weekly
[17]
National Ocean Service. (n. d.). Is sea level rising? NOAA.
https://oceanservice.noaa.gov/facts/sealevel.html
[18]
Rare.org. (n. d.). The case for protecting and managing the world's territorial seas.
https://rare.org/wp-content/uploads/2022/06/2022.06-Case-for-Territorial-Seas-Digital-Download-6-27.pdf
[19]
Bartels, M. (Apr. 17, 2023). Surprising creatures lurk in the Great Pacific Garbage Patch. Scientific American.
https://www.scientificamerican.com/article/surprising-creatures-lurk-in-the-great-pacific-garbage-patch/
[20]
Shao, E. (Apr. 19, 2023). Those seaweed blobs headed for Florida? See how big they are. The New York Times.
https://www.nytimes.com/interactive/2023/04/19/climate/seaweed-florida-sargassum.html
[21]
McKenna, A. (n. d.). Mariana trench. Encyclopedia Britannica.
https://www.britannica.com/place/Mariana-Trench
[22]
National Oceanic and Atmospheric Administration. (n. d.). How deep is the ocean? National Ocean Service.
https://oceanservice.noaa.gov/facts/oceandepth.html#:~:text=The%20deepest%20part%20of%20the,meters%20(35%2C876%20feet)%20deep.
In what year was the Madrid Protocol signed?
[23]
Gorlinski, V. (n. d.). MIddle America trench. Encyclopedia Britannica.
https://www.britannica.com/place/Middle-America-Trench
[24]
Editors of Encyclopedia Britannica. (n. d.). Peru-Chili trench. Encyclopedia Britannica.
https://www.britannica.com/place/Peru-Chile-Trench
[25]
National Oceanic and Atmospheric Administration. (n. d.). Law of the Sea convention.
https://www.noaa.gov/law-of-sea-convention#:~:text=The%201982%20Law%20of%20the,both%20natural%20and%20cultural%20resources.
[26]
United Nations. (2005). Convention on the high seas. Treaty Series, vol. 450, p. 11, p. 82.
https://www.gc.noaa.gov/documents/8_1_1958_high_seas.pdf
What is the world`s largest glacier?
[27]
Turrentine, J., & Palmer, B. (Apr. 14, 2023). Finally, a high seas treaty to protect the world's oceans. NRDC.
https://www.nrdc.org/stories/finally-high-seas-treaty-protect-worlds-oceans
[28]
Hu, S. (May 22, 2023). Shared knowledge is power in the Northern Mariana Islands. NRDC.
https://www.nrdc.org/stories/shared-knowledge-power-northern-mariana-islands
[29]
Aquino, L. (Jul. 14, 2023). The ocean is turning green. Yes it's climate change. Grist.
https://grist.org/science/the-ocean-is-turning-green-yes-its-climate-change/
[30]
Gelles, D., & Andreoni, M. (Aug. 3, 2023). The ocean's dire message. The New York Times.
https://www.nytimes.com/2023/08/03/climate/the-oceans-dire-message.html
[31]
Nogrady, B. (Aug. 9, 2023). Controlling pollution and overfishing can help protect coral reefs - but it's not enough. Nature.
https://www.nature.com/articles/d41586-023-02512-w#:~:text=09%20August%202023-,Controlling%20pollution%20and%20overfishing%20can%20help%20protect%20coral%20reefs%20%E2%80%94%20but,match%20for%20climate%2Dinduced%20heatwaves.
[32]
Berwyn, B. (Feb. 9, 2024). Extreme climate impacts from collapse of a key Atlantic ocean current could be worse than expected, a new study warns. Inside Climate News.
https://insideclimatenews.org/news/09022024/climate-impacts-from-collapse-of-atlantic-meridional-overturning-current-could-be-worse-than-expected/?utm_source=InsideClimate+News&utm_campaign=2aa65c7de7-EMAIL_CAMPAIGN_2024_02_24_02_00&utm_medium=email&utm_term=0_29c928ffb5-2aa65c7de7-327955973
[33]
Valentine, S. (Mar. 26, 2024). 'Reef stars' restored Indonesia's blast-damaged corals in just 4 years. Grist.
https://grist.org/science/coral-reefs-can-rebuild-in-just-four-years-with-a-star-and-a-little-care/?utm_source=newsletter&utm_medium=email&utm_campaign=beacon
[34]
Berwyn, B. (Apr. 15, 2024). NOAA declares a global coral bleaching event in 2023. Inside Climate News.
https://insideclimatenews.org/news/15042024/noaa-declares-global-coral-bleaching-event/
Rivers and Reservoirs
A river forms when water moves from uphill at a higher elevation to downhill, at a lower elevation, because of gravity.
Small creeks and streams frequently merge to form rivers, most of which flow into oceans.[1]
Oceans are what percent of Earth`s living space?
Rivers contain
fresh water,characterized by having low concentrations of dissolved salts and other total dissolved solids
and all of the world's rivers carry about 3.6 billion metric tons of salt from land to the ocean each year.[2]
River water sources include melting glaciers, like the
Gangotri glacier
Gangotri glacier,
P. Basak Sep. 8, 2015
Wikipedia Gangotri glacier https://en.wikipedia.org/ wiki/Gangotri_Glacier#/media/File: Gomukh_the_source_of_Ganga.jpg CC BY-SA 4.0
the source of the Ganges River in Asia.
The snows of the Andes feed the Amazon River.
A river's source could be a lake with an outflowing stream, such as
Lake Itasca
Lake Itasca Mississippi source C. Karim May 25, 2004
Wikipedia Lake Itasca https://en.wikipedia.org/ wiki/Lake_Itasca#/media/File: Lake_Itasca_Mississippi_Source.jpg CC BY-SA 3.0
in Minnesota, as the source of the Mississippi River.
The source of the
Danube River
Danube River in Budapest Visions of Domino Jul. 5, 2016
Wikipedia Danube River https://en.wikipedia.org/ wiki/Danube#/media/ File:View_from_Gell%C3%A9rt_ Hill_to_the_Danube,_Hungary _-_Budapest_(28493220635).jpg
CC BY-SA 2.0
is a spring in the Black Forest of Germany.[5]
Rivers can form
estuaries,the tidal mouth of a large river, where the tide meets the stream
and large sources of
brackish water.having more salinity than fresh water, but not as much as seawater
The Ganges begins at the confluence of Alaknanda and Bhagirathi rivers Devprayag Mar. 1, 2010
Wikipedia Ganges https://en.wikipedia.org/ wiki/Ganges#/media/File: Devprayag_-_Confluence_of_ Bhagirathi_and_Alaknanda.JPG CC BY-SA 3.0
Rivers and their
floodplainsan area of low-lying ground adjacent to a river, formed mainly of river sediments and subject to flooding
provide habitats for aquatic animals and terrestrial species.
Many of the world's large rivers experience an annual flooding cycle that is important for spreading water, nutrients and sediment into floodplains.[3]
Many cities were established around rivers, which were used primarily for irrigation, drinking water, and waste disposal, and later for power generation.[1]
A 2021 Ganges study determined that the river and its tributaries could be responsible for up to 3 billion microplastic particles entering the Bay of Bengal every day.
A 2023 study of the Ganges River in South Asia discovered that microplastic particles are trapped in riverbed sediments and carried along major river systems.
There were about 41 microplastic particles per square meter per day settled from the atmosphere, an average of 57 particles per kilogram
in riverbed sediment and one particle in every 20 liters of water.[13]
Clothes are washed in the Ganges.
Fibers represented about 99% of the sample microplastics, with rayon the dominant polymer at 82%.[13]
Large dams have been constructed near rivers to reduce flooding and to produce hydroelectricity.
Sometimes these
mitigation actions taken to reduce the seriousness of something
efforts work, but sometimes they do not, leaving those who move into locations where mitigation has been attempted subject to
unpredictable water flows, flooding and environmental damage.[3]
The Colorado River at Horseshoe Bend, Page, Arizona P. Hermans Sep. 27, 2012
Wikipedia rivers https://en.wikipedia.org/ wiki/River#/media/File: Horseshoe_Bend_TC_27- 09-2012_15-34-14.jpg CC BY-SA 3.0
Only 17% of rivers are free-flowing and within protected areas.
Freshwater species have declined by 84% since 1970 as a result of river degradation.
Free-flowing rivers sustain diverse ecosystems and food chains, provide drinking water and serve as cultural sites for billions of people.[8]
An Oregon State University study concluded that in the past 20 to 30 years 70% of fish species in Japanese and New Zealand rivers were threatened or endangered.
Poor living conditions for fish and insects exist in 50% of European, 44% of U.S., 25% of South Korea and 30% of Australian rivers.[9]
Water resources managers and scientists explore ways to restore natural river environments without further flood damage.
One of the solutions involves controlled water release from
reservoirsa large natural or artificial lake used as a source of water supply
to reconstruct natural flood patterns.[3]
The Amazon carries more water than any other river on Earth and about one-fifth of all fresh water to the oceans.[5]
The Mississippi River is North America's largest, connecting the Ohio River to the east and Missouri River to the west.[3]
In October 2022, low water levels in the Mississippi backed up about 3,000 barges.
The river and its tributaries transport more than $17 billion of farm products.[6]
Some states fed by Mississippi water are developing new ways to deal with decreasing water, including low-impact hydropower, naturally moving sediments to restore water habitats and
utilizing satellite images to create three dimensional measurements of water levels and distribution.[6]
Oceans, seas and bays contain what percent of Earth`s water?
An American Rivers report listed the Upper Mississippi River as the most endangered river of 2020 as a result of climate change, changes in land use, artificial cropland drainage
and poor watershed management and planning.
The river is prone to deadly flooding which is predicted to increase.
In 2019 floods on the river broke records resulting in submerged homes, farms, roads and businesses for almost 100 days.[7]
American Rivers called on governors in Iowa, Illinois, Missouri, Minnesota and Wisconsin to fund the
Keys to the River 2020: An Upper Mississippi River Flood Risk, Sediment and Drought Study
completed by the Army Corps of Engineers.[7]
Redlining,refusing a loan or insurance to someone because they live in an area deemed to be a poor financial risk
economic injustice and
leveean earthen barrier along a stream, lake or river that protects the surrounding land from flooding
failures disproportionally affect low income communities which are often left out of decision-making processes aimed at
economic growth, rather than human impacts.[7]
U.S. rivers U.S. Department of the Interior Jul. 27, 2009
Wikipedia list of rivers of the United States https://en.wikipedia.org/ wiki/List_of_rivers_of_ the_United_States#/media/ File:US_map_-_rivers_and_lakes3.jpg public domain
America's Most Endangered Rivers of 2020[7]
river↕
states
threats
Upper Mississippi
Illinois, Iowa, Missouri, Minnesota, Wisconsin
climate change, poor flood management
Lower Missouri
Missouri, Iowa, Nebraska, Kansas
climate change, poor flood management
Big Sunflower
Mississippi
Yazoo pumps project
Puyallup
Washington
Electron Dam
South Fork Salmon
Idaho
gold mine
Menominee
Michigan, Wisconsin
open pit sulfide mining
Rapid Creek
South Dakota
gold mining
Okefenokee Swamp
Georgia, Florida
titanium mining
Ocklawaha
Florida
Rodman Dam
Lower Youghiogheny
Pennsylvania
natural gas development
In 2023, the American Rivers list, based on river significance to people and wildlife, river threats and public influence, had changed.
America's Most Endangered Rivers of 2023[10]
river↕
states
threats
risk
Colorado
Arizona, California, Colorado, Nevada, New Mexico, Utah, Wyoming
climate change, outdated water management
ecosystem health, reliable water delivery, regional economy
Ohio
Pennsylvania, Ohio, West Virginia, Kentucky, Indiana, Illinois
pollution, climate change
clean water for 5 million people
Pearl
Mississippi
dredging and dam construction
clean drinking water, local and downstream community health, fish and wildlife habitats
Snake
Idaho, Oregon, Washington
four federal dams
Tribal treaty rights and culture, endangered salmon runs, rural and local community health
Clark Fork
Montana
pulp mill pollution
public health, fish and wildlife habitats
Eel
California
dams
fish and wildlife habitats, Tribal culture and sustenance
Lehigh
Pennsylvania
poorly planned development
clean water, fish and wildlife habitats, rural and local community health, open spaces
Chilkat and Klehini
Alaska
mining
bald eagle, fish and wildlife habitats, Tribal culture and sustenance
Rio Gallinas
New Mexico
climate change, outdated forest and watershed management
clean driking water, farming, watershed operation
Okefenokee Swamp
Georgia, Florida
mining
fish and wildlife habitats, wetlands, water quality
The U.S. and Canada share the Columbia River and the St. Lawrence River.
In the Pacific Northwest, the Columbia and its dams comprise the world's largest hydropower system, and those dams have caused contention between salmon fisheries and dam operators.
The boundary between eastern Canada and the U.S. is formed by the St. Lawrence, which flows into the Atlantic Ocean.[3]
Rio Grande river basin Kmusser Aug. 18, 2010 Wikipedia Rio Grande
https://en.wikipedia.org/wiki/Rio_Grande#/ media/File:Riogranderivermap.png CC BY-SA 3.0
In the southwestern U.S., the Colorado River flows through arid and highly populated regions, providing water to millions of people.
This river has been so dammed and diverted that it no longer reaches its previous mouth, and now ends, dried up in the Mexican desert.
Environmental groups are developing strategies for restoring the Colorado to its previous conditions.[3]
The EPA Urban Waters Partnership reconnects economically distressed urban communities with their local waterways by improving coordination among federal agencies
and community-led revitalization efforts.[12]
In December 2023 the Biden-Harris administration announced a $51 million in funding to support 18 projects in 8 states to improve aquatic habitats
using funds from the Bipartisan Infrastructure Law for the Bureau of Reclamation's
WaterSMART program.
Among them is a $20 million project for the creation of a wetland by the Southern Nevada Water Authority in the Lake Mead National Recreation Area.[14]
Projects in California will complete floodplain restoration in the Mokelumne River and create fish passages in the Eel River.
In Colorado funding will be used to repair the degraded Blue River habitat and restore the Kawuneeche Valley beaver-willow ecosystem.
In Montana Trout Unlimited and the Upper Clark Fork Basin Fish Passage Improvement Project will provide fish and recreational boat passage.
In Nevada erosion control and Las Vegas Wash wetland habitat improvements and restoration will provide a better environment for the yellow-billed cuckoo
and the razorback sucker fish.[14]
In New Mexico the Albuquerque-Bernalillo County Water Authority will reconnect 11 acres of floodplain habitat to the Rio Grande.
In Oregon the Deschutes River Conservancy and Deschutes Basin Board of Control will study restoration projects to protect the Oregon spotted frog and redband trout
and the North Unit Irrigation District will replace old fish screens to provide safer paths for rainbow trout, brook trout, whitefish, fingerling coho and kokanee.
In Washington Chelan County will study relocation and reconnection of the Peshastin Creek with its floodplain.
The city of Casper, Wyoming will design a project to restore about 3 miles of the North Casper and Knife Rivers.[14]
Funding for the Confederated Tribes of the Yakama Nation will be used to restore aquatic habitat on the Toppenish Creek and the Nason Creek
to improve salmon spawning habitat.
The Tribes will also be using funds to improve the aquatic environments of the lower Yakima River and Middle Columbia River.[14]
Nile River at night NASA Nov. 8, 2010 Visible Earth
https://visibleearth.nasa.gov/images/46820/ nile-river-delta-at-night/46821l public domain
1,855,000
Rivers have played major roles in history, transportation, warfare, culture and geography.
Civilizations have grown around river deltas, where food could be easily grown and traded.
Historically Significant Rivers[5]➔
river↕
length in km↕
continent↕
country/state↕
Amazon River Kmusser Feb. 25, 2013
Wikipedia Amazon River https://en.wikipedia.org/ wiki/Amazon_River#/media/ File:Amazonrivermap.svg CC BY-SA 3.0
Amazon
6,575
South America
Peru, Ecuador, Colombia, Venezuela, Bolivia, Brazil
Colorado
2,334
North America
Colorado, Utah, Arizona, Nevada, California
Congo
4,700
Africa
Republic of the Congo, Central African Republic, eastern Zambia, northern Angola, parts of Cameroon, Tanzania
Switzerland, Liechtenstein, Austria, Germany, France, Netherlands
St. Lawrence
1,197
North America
Ontario and Quebec in Canada, Minnesota, Wisconsin, Illinois, Indiana, Ohio, Pennsylvania, New York, Vermont, Michigan
Thames
346
Europe
England
Tigris
1,900
Asia
Iran, Iraq, Turkey, Syria
Volga
3,685
Europe
Russian Federation
Yangtze
6,300
Asia
China
Kariba reservoir Carport Dec. 15, 2012
Wikipedia Kariba reservoir https://en.wikipedia.org/wiki/ Lake_Kariba#/media/File: Zimbabwe_relief_location_map.jpg CC BY-SA 3.0
World's Largest Reservoirs[11]➔
reservoir↕
river↕
volume in in km3↕
dam↕
country↕
year built↕
Lake Kariba
Zambezi
180.6
Kariba
Zambia/ Zimbabwe
1959
Bratsk Reservoir
Angara
169.9
Bratsk
Russia
1964
Lake Volta
Volta
150.0
Akosombo
Ghana
1965
Manicouagan Reservoir
Manicouagan
141.8
Daniel-Johnson
Canada
1968
Lake Guri
Caroni
135.0
Guri
Venezuela
1986
Lake Nasser
Nile
132.0
Aswan High
Egypt
1971
Williston Lake
Peace
74.3
W. A. C. Bennett
Canada
1967
Krasnoyarsk Reservoir
Yenisei
73.3
Krasnoyarsk
Russia
1967
Zeya Reservoir
Zeya
68.4
Zeya hydroelectric station
Russia
1978
Robert-Bourassa Reservoir
La Grande
61.7
Robert-Bourassa generating station
Canada
1981
Sources:
[1]
USGS. (n. d.). Rivers, streams, and creeks.
https://www.usgs.gov/special-topic/water-science-school/science/rivers-streams-and-creeks?qt-science_center_objects=0#qt-science_center_objects
[2]
National Geographic. (n. d.). River.
https://www.nationalgeographic.org/encyclopedia/river/
[3]
Water Encyclopedia. (n. d.). Rivers, major world.
http://www.waterencyclopedia.com/Re-St/Rivers-Major-World.html
Ice melting in what location is responsible for Texas` rising coastal sea level?
[4]
Gupta, A. (2007). Large rivers: Geomorphology and management.
https://books.google.com/books?id=gXgyHLT_hwIC&pg=PA31#v=onepage&q&f=false
[5]
National Geographic. (2022). Understanding rivers.
https://education.nationalgeographic.org/resource/understanding-rivers
[6]
Smith, L. C. (Nov. 27, 2022). Long stretches of the Mississippi River have run dry. What's next? The New York Times.
https://www.nytimes.com/2022/11/27/opinion/environment/mississippi-river-drought-colorado.html
[7]
Water Online. (Apr. 14, 2020). Mississippi River named America's #1 most endangered river.
https://www.wateronline.com/doc/mississippi-river-named-america-s-most-endangered-river-0001
What are the four hot and dry deserts in the U.S.?
[8]
The NAU Review. (May 12, 2021). Only 17 percent of free-flowing rivers are protected, new research shows.
https://news.nau.edu/perry-riverine-protections/#:~:text=New%20science%20about%20the%20fate,rely%20on%20them%20%E2%80%94at%20risk.
[9]
Oregon State University. (Feb. 17, 2021). Biological assessment of world's rivers presents incomplete but bleak picture.
https://today.oregonstate.edu/news/biological-assessment-world%E2%80%99s-rivers-presents-incomplete-bleak-picture
[10]
Dominguez, C. (Apr. 18, 2023). American Rivers announces America's most endangered rivers of 2023. Water Online.
https://www.americanrivers.org/2023/04/americas-most-endangered-rivers-of-2023-spotlights-human-health-and-public-safety/
[11]
WorldAtlas. (2023). The largest human-made lakes in the world.
https://www.worldatlas.com/articles/the-largest-man-made-lakes-in-the-world.html
[12]
Environmental Protection Agency. (Jul. 18, 2023). Urban waters federal partnership.
https://www.epa.gov/urbanwaterspartners
[13]
Water Online. (Sep. 20, 2023). Rivers contain hidden sinks and sources of microplastics
https://www.wateronline.com/doc/rivers-contain-hidden-sinks-and-sources-of-microplastics-0001
[14]
Water Online. (Dec. 19, 2023). Biden-Harris administration announces more than $51M from the president's Investing in America agenda to restore and protect rivers and watersheds.
https://www.wateronline.com/doc/biden-harris-administration-announces-m-from-investing-in-america-agenda-for-water-resources-and-ecosystem-health-0001
Lakes
Lakes are created when large basins are filled with water.
Newly formed lakes are
oligotrophicrelatively low in plant nutrients and containing abundant oxygen in the deeper parts
and can sustain only a small amount of biomass.
Wind, erosion, precipitation, rivers, and other natural processes add sediments, as a lake becomes
eutrophic,relatively low in plant nutrients and containing abundant oxygen in the deeper parts
with relatively poor water quality and high biological production.[18]
Basins have been formed by glaciers during ice ages, and dams that were created by rocks and debris left behind.
The lakes in Minnesota, "The Land of 10,000 Lakes," and the Great Lakes were created by glaciers.[1]
Most of these lakes, including the Great Lakes, are often hundreds of meters deep.[3]
What is the largest ocean?
Both the
Caspian Sea
Caspian Sea
J. Schmaltz, MODIS Rapid Response Team/NASA Jun. 11, 2003
Wikipedia Caspian sea https://en.wikipedia.org/ wiki/Caspian_Sea#/media/File: Caspian_Sea_from_orbit.jpg public domain
and
Lake Baikal
Lake Baikal
J. Descloitres, MODIS Land Rapid Response Team, NASA Oct. 23, 2001
Wikipedia Lake Baikal https://en.wikipedia.org/ wiki/Lake_Baikal#/media/File: Baikal.A2001296.0420.250m-NASA.jpg public domain
were formed by plate tectonics which created faults, natural lake basins.[1]
Baikal is the world's oldest and deepest fresh water lake, and more water than all of the Great Lakes combined.[3]
Other lakes were formed from inactive volcanoes and
calderas,a bowl-shaped depression that forms when a volcano collapses
which filled with melted snow or rain.
Oregon's
Crater Lake
Crater Lake in Winter
WolfmanSF Nov. 14, 2012
Wikipedia Crater Lake https://en.wikipedia.org/ wiki/Crater_Lake#/media/File: Crater_Lake_winter_pano2.jpg CC BY-SA 3.0
was created when Mount Mazama's volcanic cone collapsed.[1]
Some lakes are created by rivers forming
meanders.a river following a winding course
The lake left behind is called an
oxbow lake.a curved lake formed where the main stream of a river has cut across the narrow end and no longer flows around the loop of the bend[1]
First letters of U.S. Great Lakes spell what common word?
Lakes can also be created by landslides or mudslides, creating piles of debris blocking the flows of streams.
Beavers also create natural dams out of tree branches can plug up rivers or streams and make large ponds or marshes.[1]
Fresh water lakes contain about 98% of usable surface water,
and play a significant role in the water cycle, as water vapor from lake surfaces evaporate into the atmosphere, falling later as precipitation.
These lakes receive the drainage from vast tracts of land, store it, pass it on seaward, or lose it to the atmosphere by evaporation.
Small lakes have a high surface area to volume ratio, and an even higher evaporation rates per volume.[2]
The Great Lakes NASA/Goddard Spaceflight Center Apr. 24, 2000
Wikipedia Great Lakes https://en.wikipedia.org/ wiki/Great_Lakes#/media/File: Great_Lakes_from_space_crop_labeled.jpg public domain
Most lakes contain fresh water, but some lakes become saline when their waters cannot combine with other fresh water lakes and rivers.
Some of these lakes were formed when they were connected to seas, but they have been shrinking since the last ice age.
Lake Bonneville,
Lake Bonneville Steplinin May 1, 2019
Wikipedia Lake Bonneville https://en.wikipedia.org/ wiki/Lake_Bonneville#/media/File: Image_of_Lake_Bonneville _shorelines.png public domain
an ancient U.S. lake, was once as big as Lake Michigan, and the
Great Salt Lake
Great Salt Lake
J. Morris Dec. 16, 2008
Wikipedia Great Salt Lake https://en.wikipedia.org/ wiki/Great_Salt_Lake#/media/ File:Great_Salt_Lake_Map.jpg
CC BY-SA 3.0
was once about 14 times larger than it is now, and it is saltier than the oceans.[3]
The Great Salt Lake is the largest saltwater lake in the Western Hemisphere.
It is a habitat for millions of migratory birds and brine shrimp and a tourism, recreation and skiing area that contributes billions of dollars to the Utah economy.[5]
Climate change and upstream water diversion have caused a 1 million acre-feet per year deficit, dropping the lake level dangerously low and endangering the ecosystem.
On September 6, 2023 five conservation and community groups recently sued Utah for its failure in protecting the Great Salt Lake and to stop its depletion.[5],[6]
Local industries depend on the lake for brine shrimping and other uses that contribute more than $2 billion to Utah's annual economy.
Water diversion has resulted in less than a third of natural annual water sources reaching the lake in the last few years.
Receding water revealed sediments containing
arsenic,a solid chemical element that is used especially in wood preservatives, alloys, and semiconductors and is extremely toxic in both pure and combined forms
mercury,a silver-white poisonous heavy metallic element that is liquid at ordinary temperatures used in batteries, in dental amalgam, and in scientific instruments
nickel,a silver-white hard malleable, ductile, metallic element capable of a high polish and resistant to corrosion used in alloys and as a catalyst
leada soft, dense, malleable metal with a relatively low melting point
and other pollutants moved by wind which formed toxic dust clouds along Wasatch Front cities and towns, home to more than 80% of Utah's poplulation.[6]
Most lakes support a lot of aquatic life, but life is rarer in salty lakes.
The
Dead Sea
Dead sea halite deposits Wilson44691 Mar. 17, 2012
Wikipedia Dead Sea https://en.wikipedia.org/ wiki/Dead_Sea#/media/File: Dead_Sea_Halite_View_031712.jpg CC BY-SA 3.0
in the Middle East is too salty to support aquatic life.[3]
The
Aral Sea,
Aral Sea Shannon1 Aug. 10, 2017
Wikipedia Aral Sea https://en.wikipedia.org/ wiki/Aral_Sea#/media/ File:Aral_Sea_watershed.png CC BY-SA 4.0
located in Central Asia, is one of the world's largest inland water bodies.
In the second half of the 20th century its area was reduced by two-fifths and its level dropped by more than 12 meters, because of
Syr Darya Syr Darya
Shannon1 Feb. 5, 2010
Wikipedia Syr Darya https://en.wikipedia.org/ wiki/Syr_Darya#/media/ File:Syrdaryamap.png CC BY-SA 4.0
and
Amu Darya
Amu Darya J. Pyrek Feb. 10, 2010
Wikipedia Amu Darya https://en.wikipedia.org/ wiki/Amu_Darya#/media/ File:Amudaryasunset.jpg CC BY-SA 2.0
river diversion for field irrigation.[2]
Some lakes, like the
Chad Basin
Chad Basin Sting and Aymatth2 May 6, 2013
Wikipedia Chad Basin https://en.wikipedia.org/ wiki/#/media/File:Chad_River_ Basin_relief_2.png CC BY-SA 3.0
in Africa, have no outflow.
Their levels rise and fall based on local climate conditions and water usage.[2]
Many cities have human-made lakes in parks.[3]
Water quality in those lakes need to be continuously monitored and maintained because humans and their pets drink, swim in, sail, and kayak in those waters.
Lakes Caspian Sea U. Dedering Nov. 26, 2010
Wikipedia Caspian Sea https://en.wikipedia.org/ wiki/Caspian_Sea#/media/File: Asia_laea_relief_location_map.jpg CC BY-SA 3.0
World's 10 Largest Lakes[4]➔
lake ↕
location ↕
type ↕
surface area in km2 ↕
volume in km3 ↕
Caspian Sea
Azerbaijan-Russia- Kazakhstan- Turkmenistan-Iran
salt water
371,000
78,200
Lake Superior
U.S. and Canada
fresh water
82,170
12,232
Lake Victoria
Tanzania-Uganda
fresh water
68,800
2,424
Lake Huron
U.S. and Canada
fresh water
59,600
3,538
Lake Michigan
U.S.
fresh water
58,000
4,918
Tanganyika
Tanzania-Congo
fresh water
32,900
18,800
Baikal
Russia
fresh water
31,722
23,013
Great Bear
Canada
fresh water
31,153
2,236
Malawi
Malawi-Mozambique- Tanzania
fresh water
29,500
30,043
Great Slave
Canada
fresh water
27,200
1,580
During summers lake water is stratified into the
epilimnionthe upper layer of water in a stratified lake
and the
hypolimnion,the lower layer of water in a stratified lake
with a
thermoclinea steep temperature change in a body of water, marked by layers above and below at different temperatures
between these two layers.
Stratification moves nutrients and dissolved oxygen, affecting lake ecology.[18]
When lakes begins to cool at the end of summer, cooling surface water sinks as its density increases, mixing water and sediment layers.
During winters there is little temperature change.[18]
Clear lakes can be easy to identify.
They don't appear muddy, or contain large algae blooms, and fish can often be seen swimming far below their surfaces.[13]
But clear lakes can contain bacteria, pesticides or toxins, so clarity doesn't always imply cleanliness.
Small amounts of algae can produce substantial toxins toxins that may not be visible from the surface.[13]
Identifying lakes that are both clear and clean requires water testing to identify possible hazards.
Clean, clear lakes can be found all over the world, usually in remote locations and national parks, where pristine snow melt fills basins between mountains.
Moraine Lake Gorgo Jan. 27, 2006
Wikipedia Moraine Lake https://en.wikipedia.org/ wiki/Moraine_Lake#/media/File: Moraine_Lake_17092005.jpg
public domain
World's 8 Cleanest Lakes[8]➔
lake ↕
location ↕
type ↕
description
Moraine Lake
Canada
glacial
surrounded by the Valley of the Ten Peaks in Banff[11]
Lake Blausee
Switzerland
freshwater
located in the midst of a 20 hectare large nature park with a landscape formed by a rock slide that led to the creation of the lake[10]
Crater Lake
Oregon
freshwater
Native Americans witnessed its formation 7,700 years ago, when a violent eruption triggered the collapse of a tall peak[9]
Lake Baikal
Russia
freshwater
at 25 million years and 1,700 m, it is the oldest and deepest lake on Earth and contains 20% of the world's total unfrozen freshwater reserve[12]
The Blue Lake
New Zealand
freshwater
located in Nelson Lakes National Park, it is known as Rotomairewhenua, translated as the land of peaceful waters and is the clearest lake in the world[15]
Lake Mashu
Japan
freshwater
caldera lake in Akan Mashu National Park, one of the deepest in Japan and frequently covered in heavy fog[14]
Attabad Lake
Pakistan
freshwater
formed after a massive 2010 landslide in the Hunza Valley in the Gilgit Baltistan Region of Northern Pakistan[16]
Lake Pehoé
Chile
freshwater
called Hidden Lake by the Tehuenches, its shoreline provides a view of Cuernos del Paine[17]
Lakes are an important natural resource, serving as recreational scenic sites and habitats for aquatic and wildlife.
These ecosystems are easily affected by their environments, including the purity of local groundwater and human activities, which can be mitigated if
those affects are identified.
Nutrients, including fertilizer
phosphorousa poisonous, combustible nonmetal which exists as white phosphorus, a yellowish waxy solid which ignites spontaneously in air and glows in the dark, and red phosphorus, a less reactive form used in making matches
and
nitrogena colorless, odorless unreactive gas that forms about 78% of Earth's atmosphere
can significantly affect algae growth, producing bacteria.[2]
10 Cleanest U.S. Lakes[7]
rank ↕
lake ↕
state ↕
pH ↕
1
Lake Louise
Florida
6.98
2
Axhandle Lake
Wisconsin
7.63
3
Bear Gully Lake
Florida
7.57
4
Lake Mooney
Virginia
8.53
5
Aberdeen Lake
Mississippi
6.71
6
Armory Lake
Florida
7.22
7
Lake Downey
Florida
7.33
8
Claytor Lake
Virginia
8.95
9
Sylvan Lake
Florida
7.00
10
Lake Spivey
Florida
6.92
A 2024 study conducted by vacation rental platform
Lake.com
analyzed
National Water Quality Monitoring Council (NWQMC)
data for 276 U.S. lakes collected between January 1, 2023 and May 28, 2024.
The researchers evaluated several water quality parameters, including
dissolved oxygen,amount of oxygen present in water
ammonia,a compound of nitrogen and hydrogen, (NH3)
lead,a soft, dense, malleable metal with a relatively low melting point
phosphorus,
sulfate,a salt of sulfuric acid, containing the anion SO42-
total dissolved solids,describe the inorganic salts and small amounts of organic matter present in solution in water
turbidity,the quality of being cloudy, opaque, or thick with suspended matter
and
pHa measure of how acidic or basic a substance or solution is
measurements.[7]
Most of both the cleanest and dirtiest lakes are located in the eastern and southeastern U.S., with many in Florida.
Lake Louise, in the affluent residential area of Isleworth, is part of the Butler Chain of Lakes, near Universal Studios.
The other clean lakes have very low ammonia, lead, phosphorus, sulfate, and total dissolved solids levels when compared to the dirtiest lakes.[7]
The researchers identified a lead-contaminated cluster of lakes in near Casselberry, Florida.
They include Lake Yvonne, Lake Marie, Lost Lake, Triplet Lake, Secret Lake, Lake Kathryn, Lake Concord, Lake Lotus, Lake Ellen, Trout Lake and Lake Griffin.
Old pipes sometimes leach lead into driking water, but lead in lakes is not natural.[7]
Eagle Falls Lake, in California, near the valley where the Coachella Festival takes place, has the highest level of lead of all the 56 lakes with available lead data.[7]
10 Dirtiest U.S. Lakes[7]
rank ↕
lake ↕
state ↕
ph ↕
1
Utah Lake
Utah
8.44
2
Lake JB Thomas
Texas
8.08
3
Lake Wichita
Texas
9.90
4
Waurika Lake
Oklahoma
8.29
5
Dave Boyer (Walters) Lake
Oklahoma
8.31
6
Lake Buchanan
Texas
8.22
7
Lake Helena
Montana
8.56
8
Lake Ellsworth
Oklahoma
8.36
9
Hammock Lake
Florida
8.43
10
Wolf Branch Canal
Florida
8.02
Sources:
[1]
National Geographic. (n. d.). Lake.
https://www.nationalgeographic.org/encyclopedia/lake/
[2]
Lane, R. K. Lakes. (n. d.). Encyclopedia Britannica.
https://www.britannica.com/science/lake
[3]
USGS. (n. d.). Lakes and reservoirs.
https://www.usgs.gov/special-topic/water-science-school/science/lakes-and-reservoirs?qt-science_center_objects=0#qt-science_center_objects
[4]
Dwyer, C. (n. d.). The 10 largest lakes of the world. When on Earth.
https://whenonearth.net/10-largest-lakes-world/
[5]
Water Online. (Sep. 6, 2023). Lawsuit targets state of Utah for failing to protect the Great Salt Lake.
https://www.wateronline.com/doc/lawsuit-targets-state-of-utah-for-failing-to-protect-the-great-salt-lake-0001
[6]
Larsen, B. (Sep. 6, 2023). Environmental groups sue Utah over crisis at the Great Salt Lake. High Country News.
https://www.hcn.org/articles/water-environmental-groups-sue-utah-over-crisis-at-the-great-salt-lake
Utah Lake L. Dauphin/NASA Earth Observatory Jun. 20, 2017
Wikipedia Utah Lake https://en.wikipedia.org/wiki/br />Utah_Lake#/media/File:Utahlake _oli_2017171_lrg.jpeg
public domain
[7]
Water Online. (Jul. 1, 2024). New study ranks cleanest and dirtiest lakes in America.
https://www.wateronline.com/doc/new-study-ranks-cleanest-and-dirtiest-lakes-in-america-0001
[8]
Economic Times. (Jul. 23, 2023). Cleanest lakes in the world.
https://economictimes.indiatimes.com/news/web-stories/these-are-the-cleanest-lakes-in-the-world/slideshow/101217855.cms?from=mdr
[9]
National Park Service. (n. d.). Crater Lake National Park.
https://www.nps.gov/crla/index.htm
[10]
Switzerland Tourism. (2024). Blausee.
https://www.myswitzerland.com/en-us/destinations/blausee/
[11]
Banff Lake Louise. (2024). Moraine Lake.
https://www.banfflakelouise.com/experiences/moraine-lake
[12]
UNESCO World Heritage Convention. (2024). Lake Baikal.
https://whc.unesco.org/en/list/754/
[13]
Lilly Center for Lakes and Streams. (Apr. 27, 2022). Clean lakes v. clear lakes.
https://lakes.grace.edu/clean-and-clear-lakes/
[14]
japan-guide.com. (2024). Lake Mashu.
https://www.japan-guide.com/e/e6802.html
[15]
Nelson Tasman. (2024). Rotomairewhenua (Blue Lake).
https://www.nelsontasman.nz/activity/rotomairewhenua-blue-lake/
[16]
Atlas Obscura. (2024). Attabad Lake.
https://www.atlasobscura.com/places/attabad-lake
[17]
TorresdelPaine.com. (2024). Pehoé Lake.
https://torresdelpaine.com/en/tourist-attraction/pehoe-lake/
[18]
Beven, K. J. (2024). Study of lakes. Encyclopedia Britannica.
https://www.britannica.com/science/hydrologic-sciences/Study-of-lakes
Precipitation Greenmind Aug. 8, 2016
Wikipedia precipitation https://en.wikipedia.org/ wiki/Precipitation#/media/File: Precipitation_longterm_mean.gif CC BY-SA 4.0
Precipitation
Precipitation refers to water released from clouds in the form of rain, freezing rain, sleet, snow or hail.
It is the primary connection in the water cycle that provides for the delivery of atmospheric water to the Earth.
Most precipitation falls as rain.[1]
Weather and humidity are related.
Warm air can hold more water vapor than cool air.
This means that if a
parcelan air bubble that keeps its shape as it rises or sinks in the atmosphere
of cool air and a parcel of warm air have the same amount of water vapor, the cool parcel has a higher
relative humiditythe amount of water vapor present in air as a percentage of the amount needed for atmospheric saturation at the same temperature
than the warm parcel.[10]
Upper atmosphere moisture cools quickly, forming large clouds that spread under low pressure conditions.
Rapid upward air flow from Earth's surface creates low-pressure areas near the ground.
Cool air fills the low pressure areas, producing precipitation.[11]
Clouds contain water vapor and cloud droplets, small drops of condensed water.
The droplets are too small to fall as precipitation, but large enough to form visible clouds, which continuously evaporate and condense.
Most of the condensed water doesn't fall as precipitation because the fall speed isn't high enough to overcome cloud
updrafts.upward air movement[1]
The first stage in precipitation occurs when tiny water droplets adhere to
condensation nuclei,tiny suspended particles, either solid or liquid, upon which water vapor condensation begins in the atmosphere
which serve as the basis for raindrops.[1]
If the particles grow large enough, they produce raindrops with fall velocities which exceed cloud updraft speeds.
Millions of tiny cloud droplets are needed to produce a single raindrop.[1]
Another more efficient mechanism is known as the
Wegener-Bergeron-Findeisen process,a process of ice crystal growth that occurs in mixed phase clouds
which leads to the rapid growth of ice crystals using water vapor in clouds.
These crystals may fall as snow, or melt and fall as rain.[1]
Cloud chart National Oceanic and Atmospheric Administration NWS Cloud Chart https://www.weather.gov/jetstream/cloudchart public domain
Acid rain results when
sulfur dioxidea colorless pungent toxic gas formed by burning sulfur in air
and
nitrogen oxidesa group of highly reactive gases, including nitrogen dioxide, nitrous acid and nitric acid
in the atmosphere are transported by wind and air currents.
These chemicals react with water to form sulfuric and nitric acids, which then fall as acid rain.[8]
SO2sulfur dioxide
+
OHhydroxide
➔
HOSO2hydroxysulfonyl radical
HOSO2hydroxysulfonyl radical
+
O2oxygen
➔
HO2water
+
SO3sulfur trioxide
SO3 (g)sulfur trioxide gas
+
H2O (l)water
➔
H2SO4 (aq)sulfuric acid
NO2nitrogen dioxide
+
OHhydroxide
➔
HNO3nitric acid
Small amounts of sulfur dioxide and nitrogen oxides come from erupting volcanoes, but most is the result of burning fossil fuels
by electric power generators, vehicles, manufacturing, oil refineries and other industries.[8]
Acid rain water
leachesdrain away from soil, ash or other material by water
aluminum from soil particles which flow into streams and lakes.
Some plants and animals can tolerate acidic waters and moderate amounts of aluminum, but others can't live in low
pHused to specify how acidic or alkaline a water-based solution is, acidic solutions have lower pH,
and alkaline solutions have higher pH
conditions.
At pH 5 most fish eggs cannot hatch, frogs can't survive below pH 4 and the mayflies frogs eat don't survive below ph 5.5.[9]
Acid rain also kills trees, other plants and animals because it removes soil minerals and nutrients required for growth.[9]
At high elevations, acid
foga thick cloud of tiny water droplets suspended in the atmosphere near Earth's surface
and clouds remove nutrients from trees, leaving them with brown or dead leaves and needles.
Unable to absorb sunlight, the trees are weakened and less able to withstand freezing temperatures.[9]
Where is the Middle America trench?
Melting snow and heavy rain can cause episodic acidification, creating short-term ecosystem stress.[9]
Acid rain causes coastal water nitrogen pollution, partially responsible for declining fish and shellfish populations.[9]
South Asia's
monsoonsa seasonal change in prevailing wind direction that often results in weeks or months of rainy weather
begin on India's west coast, with spring wind changes that push moist air from the
Arabian Sea
Arabian Sea NASA/MODIS Oct. 12, 2012
Wikipedia Arabian Sea https://en.wikipedia.org/ wiki/Arabian_Sea#/media/File: Arabian_Sea_-_October_2012.jpg public domain
toward land.[6]
Some farms experience temporary droughts, while others get too much rain, too quickly.
In 2022, monsoon rains in Pakistan left much of the country underwater and killed more than 1,500 people.
In India's technology capital, Bengaluru, September monsoon rains required workers to commute by boat.[6]
Climate change has made monsoons unpredictable for about 1.8 billion people, a quarter of Earth's population.
Because warm air holds more moisture than cool air, atmospheric moisture collects in warm air, creating longer dry spells.
When it rains the moisture falls in a short time in
delugeswhen land is overflowed by significant precipitation
amounting to normal weekly or monthly rains.[6]
Right whales are threatened in part by ice melting where?
To counteract the effects of climate change villagers dug long trenches by hand along hillsides to catch rain.
The trenches prevent rain from running into streams.
Instead, the water flows into local wells, providing a water supply after the monsoons have ended.[6]
In most years, Pacific winter storms deliver about 48 cubic miles of mountain snow, which remains frozen until the spring.
During hot and dry months, melted snow flows into rivers, lakes, reservoirs and underground aquifers.
Twenty-five million people depend on this water for irrigation, food and hydroelectric power.[7]
In 2015 California experienced a dry snow drought, when a high-pressure air mass called a
ridiculously resilient ridgelarge high-pressure mass that remains over the U.S. West Coast for prolonged periods and that diverts storms winter storms, intensifying drough
blocked winter snow storms, leaving only 25% of normal snowfall, and creating the state's worst recorded snow drought.[7]
Washington and Oregon experienced a wet snow drought.
The Pacific Northwest had a relatively wet winter in 2015, but warm temperatures produced rain, rather than snow.
Water that would have melted during the spring flowed directly into rivers, lakes and streams, and was no longer available during hot, dry months.[7]
Residents of Rolwaling, Nepal are threatened by floods caused by what?
Climate change and global warming are increasing both dry and wet snow droughts.
In 2022 California and Oregon mountains had about half as much snow as is typical and Washington had about 75% of its normal snowfall.[7]
Fog is found in coastal zones around the planet.
Its most noticeable human impact is on transportation, because shipping, road traffic and air travel and freight delays cost billions of dollars per year.[2]
But fog is also essential for plants and animals and agriculture and human health.
Along Chile's coast, cold ocean water rises to the surface carrying nutrients to wave tops
where they form fog droplet nuclei that condense and then floats over land.
Fog transports these nutrients from the ocean to the forests.[2]
Advection fog in San Francisco B. Inaglory Sep. 26, 2009
Wikipedia fog https://en.wikipedia.org/ wiki/Fog#/media/File: San_francisco_in_fog_with_rays.jpg CC BY-SA 3.0
Ocean bacteria, viruses and other organisms can be found in Italy's mountains.
They have been transported by fog droplets from the sea onto land.[2]
Fog is the main source of moisture in the Namib Desert in Southwest Africa
where it sustains vegetation providing metabolic fuel for 48 species, including the
tenebrionid beetle
Tenebrionid darkling beetle at Dar es Salaam, Tanzania
M. M. Karim Jan. 1, 2009
Wikipedia darkling beetle https://en.wikipedia.org/ wiki/Darkling_beetle#/media/ File:Darkling_beetle.jpg
GNU Free Documentation License 1.2
that captures and drinks fog.[2]
Plant material and decomposition matter provide water best when they have been wet, which usually will be from fog[5]
While persistent fog can destroy food crops, it can benefit others, including artichoke and pumpkin fields in California's central coast,
where fog creates the right light, temperature and moisture conditions for crop growth.[2]
America's most famous fog occurs in California, near the Golden Gate Bridge.[2]
In June, July and August, most of the Northern Hemisphere, including California, endures high summer temperatures.
But the average daily high in San Francisco is below 70oF (21oC), cooler than any major continental U.S. city.[3]
Anecdotal evidence from shoreline residents and scientists idicate that fog along that state's coast and the Santa Cruz region is diminishing.
The reasons for the decline aren't clear, but climate change and increasing temperatures may explain why the fog, sustaining California's redwoods,
is slowly disappearing.
Redwoods and Torrey pines are showing signs of distress.[2]
One study demonstrated that fog has decreased about 30% in the past 60 years along the west coast.
In the 1950s, coastal California got about 12 hours of fog per day during fog season.
That has now been reduced to about 9 hours per day.[2]
Fog also reduces air temperature.
One study that analyzed reduced fog showed a disproportionately high number of excessive heat deaths in coastal zones when fog is reduced.
Those used to cooler temperatures because of fog may not know how to prepare themselves to deal with excess heat.[2]
Studies in Sao Paulo and Los Angeles demonstrate that human emissions produced fog near industrial centers.
Pollution control efforts have reduced this reflective fog loaded with industrial pollution, which is more reflective than clean haze.
The reduction of smog allows more warming, further diminishing fog.[2]
Icy fog, called
pogonipa dense winter fog containing frozen particles that is formed in deep mountain valleys of the western U.S.
by the Shoshone, forms in some high valleys of the Western U.S.
This fog forms only in conditions cold enough to threaten respiratory health.
Indigenous people and settlers recognized and feared this fog.[2]
Water harvested from fog is becoming increasingly important for people in arid, subtropical areas that are drying out with global warming.[2]
Fog collection in Alto Patache, Atacama Desert, Chile N. Saffie Jul. 5, 2013
Wikipedia fog collection https://en.wikipedia.org/ wiki/Fog_collection#/media/ File:Atrapanieblas_en_Alto_Patache.jpg CC BY-SA 2.0
As greenhouse gases trap more solar energy on the planet's surface, ocean currents are shifting poleward and the tropics and subtropics are expanding,
The position and direction of winds that affect fog formation and persistence are changing,
threatening fog-dependent ecosystems, including the biodiverse mountain forests of Mexico, Costa Rica and Hawaii.[2]
These forests and special plant communities might be the most vulnerable because rising temperatures could quickly push their fog belt upward,
exposing sensitive cloud forests with many species that can only survive in fog zones.[2]
Fog nets can capture between 200 and 400 liters of fresh water per day, providing a reliable water source.
More than 2,000 have been installed across Peru, Bolivia, Colombia and Mexico.
Fog collected in the Peruvian provinces of Cusco, Tacna and Arequipa is clean, and the water it creates can be used by humans.[4]
In 2009, German conservationists planted she-oak trees in Peru to create a natural fog-catching system to replicate ancient water-capturing methods that
collected water dripping from fog-covered plants.
In Lima, Peru, one of the world's most polluted cities, fog nets pick up pollution.
The condensed water can be used for crops and animals, but not for human consumption.[4]
In Morocco, lack of water has affected rural Amazigh communities, creating a daily burden for women, who spent more than three hours per day
carrying water from communal wells to their homes.
They now use fog nets.
Similar fog harvesting successes have helped residents of Namibia, Bolivia and Chile.[4]
Water purification techniques may make polluted fog water fit to drink.
Fog collection may provide reliable water for drought-stricken communities.
But while new technologies are being brought to bear on the problem the basic techniques of fog catching go back centuries.[4]
Sources:
Cloudy with a 20% chance of uncertainty S. Kobilka Aug. 8, 2022
YouTube https://www.youtube.com/watch?v=T_fNqOFTO-E Embedded video, no copy made
[1]
USGS. (n. d.). Precipitation and the water cycle.
https://www.usgs.gov/special-topic/water-science-school/science/precipitation-and-water-cycle?qt-science_center_objects=0#qt-science_center_objects
[2]
Berwyn, B., Hasemyer, D., & Pickett, M. (Oct. 10, 2021). With a warming climate, coastal fog around the world is declining.
https://insideclimatenews.org/news/10102021/coastal-fog-global-warming/
[3]
Branch, J., Riggio, N., & Reinhard, S. (Sep. 14, 2022). The elusive future of San Francisco's fog. The New York TImes.
https://www.nytimes.com/interactive/2022/09/14/climate/san-francisco-fog.html?campaign_id=2&emc=edit_th_20220922& instance_id=72615&nl=todaysheadlines®i_id=75304528&segment_id=107765 &user_id=41c41844ba6d41e6e92a0dd7bae484d3
[4]
Trevino, M. T. (Feb. 23, 2020). The etherial art of fog catching. BBC.com.
https://www.bbc.com/future/article/20200221-how-fog-can-solve-water-shortage-from-climate-change-in-peru
[5]
Mitchell, D., et al. (Jan. 17, 2020). Fog and fauna of the Namib Desert: past and future. Ecosphere.
https://esajournals.onlinelibrary.wiley.com/doi/10.1002/ecs2.2996
What is the source of the Ganges River?
[6]
Fountain, H. (Oct. 4, 2022). South Asia's monsoon is inextricably linked, culturally and economically, to much of Asia. Climate change is making it increasingly violent and erratic. The New York Times.
https://www.nytimes.com/interactive/2022/10/04/climate/south-asia-monsoon-climate-change.html?campaign_id=54&emc=edit _clim_20221007&instance_id=73974&nl=climate-forward®i_id=75304528&segment_id=109287&te=1&user_id=41c41844ba6d41e6e92a0dd7bae484d3
[7]
Nichols, J. (Oct. 12, 2022). The problem with snow drought. Parched.
https://grist.org/parched/the-problem-with-snow-drought/
[8]
Environmental Protection Agency. (Jun. 24, 2022). What is acid rain?
https://www.epa.gov/acidrain/what-acid-rain
What is the weight of one gallon of water?
[9]
Environmental Protection Agency. (Jun. 24, 2022). Effects of acid rain.
https://www.epa.gov/acidrain/effects-acid-rain
[10]
National Oceanic and Atmospheric Administration. (n. d.). Discussion of humidity.
https://www.weather.gov/lmk/humidity#:~:text=Warm%20air%20can%20possess%20more, if%20the%20air%20is%20warmer.
[11]
GoWeather. (Mar. 2, 2021). What is humidity and how does humidity affect weather.
https://goweatherforecast.com/news/how-does-humidity-affect-weather-193
Groundwater
Groundwater contamination by nitrates USGS
Groundwater Quality https://www.usgs.gov/special-topic/water-science-school /science/groundwater-quality?qt-science _center_objects=0#qt-science_center_objects public domain
Falling rain and melting snow seep into Earth's cracks and crevices to form and recharge groundwater.
The ground becomes saturated at the
water table.the level below which the ground is saturated with water
When that occurs, groundwater seepage can sometimes be seen when water-bearing layers emerge on the land surface in both rural and urban settings.[1]
Water in
aquifersa body of permeable rock which can contain or transmit groundwater
reaches the surface through springs, is discharged into lakes and streams, or extracted from man-made or artesian wells.
In areas where material above the aquifer is permeable, pollutants can readily sink into groundwater supplies.[1]
Groundwater is used for drinking by more than 50% of the U.S. population, but the most substantial use of groundwater is crop irrigation.[1]
In some areas of the world people face serious water shortages because groundwater is used faster than it can be recharged.
In other areas groundwater is polluted by human activities related to landfills,
septic tanks,a tank used to hold domestic water wastes
leaky underground gas tanks and from overuse of fertilizers and pesticides.
If groundwater becomes polluted, it will no longer be safe to drink.[1]
Some of the substances introduced into groundwater include
antimony,a lustrous gray metalloid, found in nature mainly as the sulfide mineral stibnite
arsenic,a solid chemical element that is used especially in wood preservatives, alloys, and semiconductors and is extremely toxic in both pure and combined forms
cadmium,a soft, malleable, bluish white metal found in zinc ores
chromium,a blue-white metallic element found naturally only in combination and used especially in alloys and in electroplating
copper,a highly conductive metallic chemical element that is easily formed into sheets and wires
cyanide,a large group of poisonous chemical compounds used to make plastics and to extract and treat metals
lead,a soft, dense, malleable metal with a relatively low melting point
mercury,a silver-white poisonous heavy metallic element that is liquid at ordinary temperatures used in batteries, in dental amalgam, and in scientific instruments
nitrate,usually combined with sodium or potassium and used as a fertilizer
nitrite,a salt or ester of nitrous acid
silver,a malleable, polishable, metallic chemical element, has the highest thermal and electric conductivity of any substance, used in jewelry, tableware, electronics, and as an antimicrobial
and
sulfatea salt of sulfuric acid, containing the anion SO
from a variety of industrial processes.
Others, including
aluminum,a silver-white malleable, conductive, light metallic chemical element that resists weathering, and is the most common metal in Earth's crust
barium,a silver-white metallic element used in drilling fluid and vacuum tubes, and as a contrast agent in medical imaging
beryllium,a steel-gray, light, brittle chemical element that occurs naturally in beryl used as a hardening agent in alloys
iron,a strong, hard magnetic silvery-gray metal used as a material for construction and manufacturing, especially in the form of steel
manganese,a grayish-white, hard, brittle metallic element that resembles iron but is not magnetic and is used in alloys, batteries, and plant fertilizers
nickel,a silver-white hard malleable, ductile, metallic element capable of a high polish and resistant to corrosion used in alloys and as a catalyst
selenium,a photosensitive element that occurs in crystalline and amorphous forms, obtained as a by-product in copper refining, used in glass, semiconductor devices and alloys
sodium,a silver-white, soft, waxy, ductile, chemically-active element that occurs abundantly in nature
thalliuma soft poisonous metallic element that physically resembles lead, occurs sparsely in a number of common ores, used in the form of compounds especially in photosensitive devices
and
zinca bluish-white, ductile metallic element when pure and heated, brittle at ordinary temperatures, an essential micronutrient for both plants and animals, used especially in alloys and as a protective coating in galvanizing iron and steel
occur naturally and mix with groundwater.[2]
Between 1993 and 2010 Earth's tilt changed by 31.5 inches (80 cm) due to human groundwater pumping and the removal of
2,150 gigatons of water from natural reservoirs in the planet's crust.
If the equivalent amount of water was added to Earth's oceans it would increase sea level by 0.24 inches (6 mm).
Earth's tilt affects global weather patterns which contribute to climate change.[3]
A 2023 international study using satellite and monitoring well data discovered that worldwide groundwater levels are dropping in more than 40 countries,
faster in dry climates where agriculture uses about 70% of the groundwater supply.
The researchers determined that groundwater levels were not declining below uncultivated land.
Rises in groundwater level were the result of policies and regulations that increased usage of recycled water and diverted river flows or
charged higher fees for groundwater use.[4]
Sources:
[1]
Groundwater Foundation. (2020). What is groundwater?
https://www.groundwater.org/get-informed/basics/whatis.html
[2]
USGS. Rivers, streams and creeks.
https://www.usgs.gov/special-topic/water-science-school/science/ rivers-streams-and-creeks?qt-science_center_objects=0#qt-science_center_objects
[3]
Pultarova, T. (Jun. 18, 2023). Humans are pumping out so much groundwater that it's changing Earth's tilt. Space.com.
https://www.space.com/earth-tilt-changed-by-groundwater-pumping?utm_term=49331890-489B-422D-BE22-6D587467AE8C&utm_campaign=58E4DE65-C57F-4CD3-9A5A-609994E2C5A9&utm_medium=email&utm_content=9C0A63A2-0F8A-4AA3-BDE2-6BD955675E77&utm_source=SmartBrief
[4]
Gross, L. (Jan. 24, 2024). Groundwater levels around the world are dropping quickly, often at accelerating rates. Inside Climate News.
https://insideclimatenews.org/news/24012024/world-groundwater-levels-dropping-quickly/
Weather Events
El Niño affects changes in phytoplankton NASA Jan. 1, 1998
Wikipedia El Niño https://en.wikipedia.org/ wiki/El_Ni%C3%B1o#/media/ File:ElNinoBloom_1998JanJul.gif public domain
South American fishermen first noticed periods of unusually warm water in the Pacific Ocean in the 1600s, calling them
El Niñothe cycle of warm and cold sea surface temperature of the tropical central and eastern Pacific Ocean accompanied by high air pressure in the western Pacific and low air pressure in the eastern Pacific
de Navidad because these events peaked in December, when trade winds weaken and warm water is pushed eastward, toward the west coast of the Americas.[1]
El Niño has a significant affect on weather.
The warmer waters cause the Pacific
jet streama narrow band of strong westerly air currents that circles the Earth several miles above its surface
to move southward, resulting in warmer and dryer areas in the northern U.S. and Canada.
In the U.S. Gulf Coast and Southeast El Niño produces wetter weather and flooding.[1]
El Niño also affects Pacific coast marine life.
During normal conditions, upwelling brings water from the deep ocean to the surface.
This water provides a lot of nutrients but during El Niño upwelling weakens or stops, decreasing
phytoplanktonplankton consisting of microscopic plants
populations off the coast, affecting fish that serve as part of the food chain.[1]
El Niño is characterized by
average sea surface temperatures in the
equatorial Pacific Oceandefined by latitudes between 5oN and 5oS and longitudes between 120oW and 170oW
were at least 0.5oC (0.9oF)
warmer than average in the preceding month
the anomaly persisted or is expected to persist for 5 consecutive, overlapping 3-month periods,
for example December, January and February or January, February and March or February, March and April
the atmosphere over the tropical Pacific exhibits one or more of the changes commonly associated with El Niño including
weaker than usual easterly trade winds,
reduced cloudiness and rainfall over Indonesia and a corresponding increase in the average surface pressure or
increased cloudiness and rainfall in central or eastern part of the basin and a corresponding drop in the average surface pressure.[3]
El Niño and La Niña influence National Oceanic and Atmospheric Administration May 11, 2022
https://www.climate.gov/enso public domain
La Niñaan oceanic and atmospheric phenomenon that is the colder counterpart of El Niño
is also sometimes called El Viejo, anti-El Niño, or simply "a cold event."
La Niña has the opposite effect of El Niño.
During La Niña events, trade winds are stronger than usual, pushing more warm water toward Asia.
Off the west coast of the Americas, upwelling increases, bringing cold, nutrient-rich water to the surface.[1]
This cold water in the Pacific pushes the jet stream northward, leading to lead to drought in the southern U.S. and heavy rains and
flooding in the Pacific Northwest and Canada.[1]
During a La Niña year, winter temperatures are warmer than normal in the South and cooler than normal in the North.
La Niña can also lead to a more severe hurricane season.[1]
La Niña is characterized by
average sea surface temperatures in the
equatorial Pacific Oceandefined by latitudes between 5oN and 5oS and longitudes between 120oW and 170oW
cooler than average in the preceding month
an average anomaly of at least -0.5oC has persisted or is expected to persist for 5 consecutive, overlapping 3-month periods,
for example December, January and February or January, February and March or February, March and April
the atmosphere over the tropical Pacific exhibits changes commonly associated with La Niña, including
stronger than usual easterly trade winds,
an increase in cloudiness and rainfall over Indonesia and a corresponding drop in average surface pressure,
a decrease in cloudiness and rainfall in the eastern tropical Pacific and an increase in the average surface pressure.[3]
Over the last 50 years oceans have absorbed more than 90% of the heat generated by human-produced global warming.
Rising sea level temperatures increase hurricane energy, slow atmospheric circulation, and cause hurricanes to move more slowly over land.[2]
Sources:
[1]
National Oceanic and Atmospheric Administration. (Oct. 5, 2017). What is eutrophication? National Ocean Service.
https://oceanservice.noaa.gov/facts/ninonina.html#:~:text=La%20Ni%C3%B1a%20 causes%20the%20jet,contain%20more%20nutrients%20than%20usual.
[2]
Denchak, M. (Jun. 26, 2022). Hurricanes and climate change: Everything you need to know. NRDC.
https://www.nrdc.org/stories/hurricanes-and-climate-change-everything-you-need-know
[3]
National Oceanic and Atmospheric Administration. (May 11, 2022). El Niño & La Niña (El Niño-Southern Oscillation). Climate.gov.
https://www.climate.gov/enso
Deserts
About a third of Earth's land surface is desert, a land area that receives, on average, less than 250 mm per year, about 10 inches, of annual precipitation,[2]
which means that in some years a desert may not receive any precipitation.
The word desert comes from the Latin term desertum, meaning an abandoned place.[1]
Deserts 101 National Geographic Jun. 28, 2019
YouTube https://www.youtube.com/watch?v=n4crvs-KTBw Embedded video, no copy made
Little water and low humidity seem to conflict with survival,
but deserts have served has homes to hunter-gatherers, including Native Americans in North and Central America and Kalahari Bushmen and Australian aborigines.
The Gobi desert was part of the Silk Road, a trade route between the Far East and Europe.[11]
Some deserts experience wide daily and annual temperature fluctuations of both extreme cold and extreme heat.
Rock and sand absorb heat during the day and release it at night.[11]
Deserts are fragile
biomes,a large naturally occurring community of flora and fauna occupying a major habitat
differing depending on their climate, location and aridity which influence ecology and the food chain.
High evaporation produces sandy soil, affecting what plants and animals can survive.
Some are unique to the desert environment.[11]
Deserts are home to 17% of the human population who have adapted to low-water availability environments, as well as
livestock including camels, goats, and antelope that provide food and livelihood for people.
Desert shrubs and trees that produce fruit such as dates, figs, and olives.[11]
Climate change and global warming affect precipitation patterns which affect deserts and their biomes.
While the sizes of some deserts may increase due to
desertificationprocess by which fertile land becomes desert, usually drought, deforestation or poor agricultural practices
others will become wetter and more humid, affecting both
florathe plants of a particular region, habitat, or geological period
and
fauna.the animals of a particular region, habitat, or geological period[11]
The birth of
eremologya science concerned with the desert and its phenomena
began in the 1960s as human geography, ecology and conservation led to studies on pollution, public health and environmental standards.
In 1994 UNESCO appointed a chairperson dedicated to eremology with the aim of preserving the desert biome for cultural and ecological reasons.[11]
Research suggests that bacteria located in massive aquifers below desert surfaces captures carbon and
several large solar arrays and wind power production systems are located in deserts.
Earth has 15 mineral deposit types and 13 of them are found in deserts, making them important mineral resources.
When water leaches through the ground or quickly evaporates minerals, including
salt,any chemical compound formed from the reaction of an acid with a base, with all or part of the hydrogen of the acid replaced by a metal or other cation
boratesa salt in which the anion contains both boron and oxygen, as in borax
and
gypsum,a soft white or gray mineral consisting of hydrated calcium sulfate which occurs chiefly in sedimentary deposits
are deposited.[11]
There are four types of deserts:
polara desert region in an ice cap climate,
subtropicalfound along the Tropic of Cancer between 15oN and 30oN of the equator or along the Tropic of Capricorn between 15oN and 30oS of the equator,
cold wintercharacterized by cold winters with snowfall and large rainfalls widely during the winter and occasionally over the summer and
cool coastal.occur in cool to warm areas along a continental coast between 20o to 30o latitude, have cool winters and long, warm summers where coastal winds blow in an easterly pattern and prevent moisture from moving onto the land[2]
10 Largest Deserts[1]
desert↕
area in km2↕
location
description
image
Antarctic
14,000,000
Antarctica
largest cold desert
coldest, driest, windiest and highest continent
rain turn into small snowflakes and cover the outer surface of the enormous ice sheets[1]
Antarctic desert Rex Jun. 16, 2005
Wikipedia List of deserts by area https://en.wikipedia.org/wiki/ List_of_deserts_by_area#/media/ File:Antarctica_surface.jpg
public domain
Arctic
13,985,000
Arctic Ocean islands north of Norway and Russia
stretches across an area of the Arctic Ocean 2,000 km from east to west and 1,000 km from north to south
covers several island groups of the north coast of Norway and Russia[1]
Arctic desert J. Schmaltz/NASA Earth Observatory Jun. 28, 2010
Wikipedia List of deserts https://en.wikipedia.org/wiki/ List_of_deserts_by_area#/media/ File:Sunny_Skies_over_the_ Arctic_in_Late_June_2010.jpg
public domain
Sahara
9,200,000
North Africa
largest hot desert
covers parts of Algeria, Chad, Egypt, Libya, Mali, Mauritania, Morocco, Niger, Western Sahara, Sudan, and Tunisia, 25% of Africa's landmass
name derived from the Arabic word çahra for desert[2]
bordered in the west by the Atlantic Ocean, in the north by the Atlas Mountains and Mediterranean Sea, in the east by the Red Sea and in the south by the Sahel
northern latitudes are arid subtropical with two rainy seasons[1]
southern latitudes are also arid but more tropical and have only one rainy season[3]
Sahara desert NASA Feb. 11, 2002
Wikipedia List of deserts https://en.wikipedia.org/wiki/ List_of_deserts_by_area#/media/ File:Sahara_satellite_hires.jpg
public domain
Australian
2,700,000
Australia
covers approximately 18% of the landmass of the Australian mainland[1]
composed of Great Victoria Desert, Great Sandy, Tanami, Simpson, Gibson, Little Sandy, Strzelecki, Sturt Stony, Tirari and Pedirka deserts[4]
Australian desert Reto Stöckl/NASA Goddard Space Flight Center May 19, 2005
Wikipedia List of deserts https://en.wikipedia.org/wiki/ List_of_deserts_by_area#/media/ File:Australia_satellite_plane.jpg
public domain
Arabian
2,330,000
far Western Eurasia, in the Arabian Peninsula
includes the the Ar-Rub Al-Khali
known as The Empty Quarter[1]
bordered to the north by the Syrian Desert, to the northeast and east by the Persian Gulf and the Gulf of Oman, to the southeast and south by the Arabian Sea and the Gulf of Aden and to the west by the Red Sea[5]
Arabian desert NASA World Wind 1.4 Oct. 3, 2008
Wikipedia List of deserts https://en.wikipedia.org/wiki/ List_of_deserts_by_area#/media/ File:Arabian_Desert.png
public domain
Gobi
1,295,000
Northern China and Southern Mongolia
rainshadow desert
home to rare animals such as snow leopards and Bactrian camels
the name Gobi is dervided from from Mongolian gobi meaning waterless place[1]
much of the desert is bare rock[6]
Gobi desert Emilfarb Oct. 2, 2008
Wikipedia List of deserts https://en.wikipedia.org/wiki/ List_of_deserts_by_area#/media/ File:Gobi.png
public domain
Kalahari
900,000
Southern Africa
covering most of Botswana, as well parts of Namibia, and South Africa
name from the Tswana word Kgala meaning the great thirst[1]
3,000 feet above sea level
bedrock exposed only in the low vertical-walled hills called kopjes
three other surfaces include sand sheets, longitudinal dunes and vleis
northern part of the desert has open woodlands, palm trees growing among thorn brush and evergreen and deciduous forests
one of the largest trees is the baobab
also contains the Okavango Swamp that supports reeds, papyrus, pond lilies, and other water-loving plants[7]
Kalahari desert Emilfarb Oct. 2, 2008
Wikipedia List of deserts https://en.wikipedia.org/wiki/ List_of_deserts_by_area#/media/ File:Kalahari.png
public domain
Patagonian
620,000
Argentina
cold desert scrub steppe, made up of rocky shrubland and thorn thicket and experiencing year-round frosts and constant winds
home to animals including foxes, llamas and armadillos[1]
Andes mountains form the western boundary and the Atlantic Ocean forms the eastern boundary[10]
Patagonian desert Emilfarb Oct. 2, 2008
Wikipedia List of deserts https://en.wikipedia.org/wiki/ List_of_deserts_by_area#/media/ File:Patagonian.png
public domain
Syrian
520,000
Middle East
southern part of the Syrian Desert merges with the larger Arabian Desert
bare and rocky, and contains scattered wadis[1]
substantially covered by lava flows
now crossed by several major roads and oil pipelines
the southern sector is inhabited by several nomadic tribes and breeders of Arabian horse breeders[8]
Syrian desert Emilfarb Oct. 2, 2008
Wikipedia List of deserts https://en.wikipedia.org/wiki/ List_of_deserts_by_area#/media/ File:Syrian_Desert.png
public domain
Great Basin
492,000
Western U.S.
home of Great Basin National Park[1]
bordered by the Sierra Nevada range on the west, the Wasatch Mountains on the east, the Columbia Plateau on the north
and the Mojave Desert on the south
has an internal drainage system
surface precipitation flows into closed valleys and does not reach the sea[9]
Great Basin desert Kmusser May 8, 2022
Wikipedia List of deserts https://en.wikipedia.org/wiki/ List_of_deserts_by_area#/media/ File:Great_Basin_map.gif CC BY-SA 3.0
There are four major hot and dry deserts in the U.S.[12]
One is the Great Basin.
Agave flowers, Big Bend National Park, Chihuahuan desert National Park Service
Wikipedia Chihuahuan desert https://en.wikipedia.org/wiki/ Chihuahuan_Desert#/media/File: Big_Bend_National_Park_PB112611.jpg
public domain
At 250,000 square miles the Chihuahuan is the largest desert in North America.
It spans Southern New Mexico, Eastern Arizona, portions of Southwest Texas, and south into Mexico's Central Highlands.
The Sierra Madre Occidental borders the Chihuahuan Desert to the west and the Sierra Madre Oriental to the east.
The 1,900-mile Rio Grande and Rio Bravo pass through it, providing its water supply
Texas' Big Bend National Park protects 800,000 acres of its flora and fauna.[12]
The Mojave Desert is the smallest at more than 20 million acres (31,250 square miles).
It spans parts of California, Nevada, Utah, and Arizona, from the Sierra Nevada Range and California Montane Chaparral and Woodlands in the west,
and the San Gabriel and San Bernardino Mountains in the southwest, to the Colorado Plateau and Arizona Mountain Forests to the east.
The Mojave is a transition zone between the Great Basin Desert to the north and the Sonoran Desert to the south.[12]
Its highest point is the 11,049-foot summit of Telescope Peak in the Panamint Mountains to the lowest point in North America, the Badwater Basin in Death Valley
at 282-feet below sea level, the driest and hottest location in the U.S.
The Mojave is also home to Joshua Tree National Park and the Mojave National Preserve, federally protected sites.
Wildlife include bighorn sheep, mountain lions, black-tailed jackrabbits, desert tortoises and the Devil's Hole pupfish, which lives only in this desert.[12]
Also called the Desierto de Altar, the subtropica Sonoran Desert spans 120,000 square miles in Southwestern Arizona, Southeastern California,
and parts of the Mexican states of Baja California Sur, Baja California and Sonora.
It includes the Colorado and Yuma deserts.
It is the most biologically diverse, with 100 reptiles, 2,000 native plants, 60 mammals, 30 native fish, 20 amphibians, and 350 birds.
The Colorado River and the Gila River provide its groundwater with winter and summer rain.[12]
Mesquite dunes, Death Valley in the Mojave desert B. Inaglory Oct. 22, 2007
Wikipedia Mojave desert https://en.wikipedia.org/wiki/ Mojave_Desert#/media/File: Mesquite_Sand_Dunes_in_Death_Valley.jpg CC BY-SA 3.0
Sources:
[1]
Safaris Africana. (n. d.). The largest deserts in the world.
https://safarisafricana.com/largest-deserts-in-the-world/
[2]
Geology.com. (2023). The world's largest deserts.
http://geology.com/records/largest-desert.shtml
[3]
Gritzner, J. A., & Peel, R. F. (Apr. 20, 2023). Sahara desert. Encyclopedia Britannica.
https://www.britannica.com/place/Sahara-desert-Africa
[4]
Richards, J. (Apr. 20, 2016). Australia's 10 deserts. Australian Geographic.
https://www.australiangeographic.com.au/topics/science-environment/2016/04/australias-10-deserts/#:~:text=Australian%20deserts%20average%20an%20annual,fall%20in%20a%20single%20day.
[5]
Owen, L., et al. (2023). Arabian desert. Encyclopedia Britannica.
https://www.britannica.com/place/Arabian-Desert
[6]
Petrov, M. P., & A;itto, G. S. (2023). Gobi desert. Encyclopedia Britannica.
https://www.britannica.com/place/Gobi
Saguaros thrive in the Sonoran Desert west of Tucson D. Meeks May 9, 2019
Image taken by and used with permission of the author CC BY-SA 4.0
[7]
Silbauer, G. B., & Logan, R. F. (Apr. 13, 2023). Kalahari desert. Encyclopedia Britannica.
https://www.britannica.com/place/Kalahari-Desert
[8]
Rafferty, J. P. (Sep. 25, 2017). Kalahari desert. Encyclopedia Britannica.
https://www.britannica.com/place/Syrian-Desert
[9]
Lotha, G., & Rafferty, J. P. (May 15, 2022). Great Basin. Encyclopedia Britannica.
https://www.britannica.com/place/Great-Basin
[10]
Wood, K. M. (Sep. 26, 2022). A-Z Animals.
https://a-z-animals.com/blog/the-patagonian-desert/
[11]
Environmentalscience.org. (n. d.). Deserts as ecosystems and why they need protecting.
https://www.environmentalscience.org/deserts-ecosystems#:~:text=Desert%20Resources&text=The%20desert%20biome%20is%20one,for%20local%20and%20global%20economy.
[12]
WorldAtlas. (n. d.). The major deserts of the United States.
https://www.worldatlas.com/deserts/the-major-deserts-of-the-united-states.html
Drought
Global drought frequency and duration increased by about a third since 2000.
More than 2.3 billion people around the world are currently facing water stress.[1]
Where are ridiculously resilient ridges found?
A United Nations report concluded that from 1970 to 2019, weather, climate and water hazards
accounted for 50% of disasters and 45% of disaster-related deaths, primarily in developing countries.
Droughts only represent 15% of natural disasters killing 650,000 people in that time period.[2]
More than 10 million have died due to major drought events over the past 100 years.
By 2050 drought could affect more than 75% of the world's population.[2]
As many as 5.7 billion people could live in areas with water shortages for at least one month a year
and more than 215 million people could be displaced from their homes.[1]
Drought and high temperatures created devastating 2020 bushfires in Tuggeranong, Australia Nick D. Jan. 29, 2020
Wikipedia drought https://en.wikipedia.org/ wiki/Drought#/media/File: Orroral_Valley_Fire_viewed_from _Tuggeranong_January_2020.jpg CC BY-SA 4.0
Drought inflicts severe burdens on women and girls in emerging and developing countries,
affecting their education levels, nutrition, health, sanitation and safety.
Almost 160 million children are exposed to severe and prolonged droughts.
By 2040 one in four children will likely be living in areas with extreme water shortages.[3]
Women who carry out agricultural responsibilities are often not recognized as farmers.
This limits their income and technology and ability to access sustainability practices.[4]
Some women have been successful.
In India, women developed an underground rainwater catchment system.
In Benin, West Africa, a solar power system irrigates fields so women don't have to collect and transport water from rivers and aquifers.[4]
Drought has been declared in parts of England. The first six months of 2022 were the driest since 1976.
The National Drought Group estimates that by 2050 some rivers could have only 20% of their current water supplies.
Temperatures could increase by 7Co due to climate change.
(Degree changes are noted as Co or Fo while specific temperatures are noted as oC or oF.)
In July 2022, U.K. temperatures were above 40oC for the first time.[1]
The Italian government declared a state of emergency in five regions in July 2022 because of a drought, the worst in 70 years.
About a third of Italy's 17 million citizens live around the Po River, with more than half of the nation's pigs and cattle.
The drought has threatened olive oil and risotto rice supplies, significantly raising their prices.[1]
France is experiencing its worst drought since in 1958, and is dealing with national water use restrictions.
The country's corn harvest is expected to be 20% lower than in 2021.[1]
Portugal recorded its hottest July ever, with 99% of the country suffering severe or extreme drought.
Average temperatures were just over 40oC, almost three degrees higher than the usual July average.[1]
What are the four types of deserts?
The Netherlands is one of the world's flattest and most densely populated countries, and the world's second leadeing exporter of farm products.
Climate change has produced hot, dry summers, reducing fresh water Alpine snowmelt that normally flows into the Rhine River.
As less fresh water flows down the Rhine toward the North Sea, seawater moves landward, toward clean home and farm water supplies.[17]
In August 2022, the Rhine's flow was at a record low, forcing farmers in Enshede to illegally siphon water from ponds.
As a result, city planners approved construction of ditches in grassy areas to catch rainwater.
Concrete tiles and other paved surfaces were removed to expose water-absorbing soil and brooks and streams were reshaped reduce runoff.[17]
Some Dutch water boards have been helping growers dry out fields since the Middle Ages.
Now they are assisting farmers in keeping their land wet by using efficient drip irrigation.[17]
Around 75% of Romania is affected by drought. The country's cereal crop is expected to decrease by 30 million metric tons.[1]
Climate change and drought foring hard choices across California NBC May 9, 2022
YouTube https://www.youtube.com/watch?v=vEAFzgsRQs8 Embedded video, no copy made
Drought has devastating effects on ecosystems
the percentage of plants affected by drought has more than doubled in the last 40 years, with about 12 million
hectares of land lost each year due to drought and desertification[11]
ecosystems turn into carbon sources, especially during droughts, and have been located on five continents[12]
rapid increases in surface temperature correlate with declining biodiversity and higher extinction rates[13],[14]
in 2019 and 2020, the Australian megadrought created megafires and massive habitat loss[15]
between 2000 and 2010, the Amazon experienced three widespread droughts, triggering forest fires.[16]
But there are solutions
proactive measures can reduce risks and increase resilience of ecosystems and communities via sustainable land management and ecosystem restoration[5]
in the last 20 years, Nigerian farmers have reduced drought risks by creating new agroforestry systems on 5 million hectares over 20 years[6]
Colombian farmers created an ecological restoration-based education program that produced 71 novel nursery gardens and
400,000 seedlings of 21 native forest species[7]
What made recent western U.S. wildfires more extreme?
a 2017 California case study showed that an increase of about 100 drought stories over two months was associated
with a reduction of 11% to 18% percent in typical household water-use[8]
limiting global warming to 1.5Co, along with regenerative land and improved water management practices,
is expected to reduce extreme drought events[9]
a paradigm shift from reactive and crisis-based approaches
to proactive and risk-based drought management approaches.[10]
Sources:
A dry lakebed in California in its worst megadrought in 1,200 years
NOAA Mar. 15, 2009
Wikipedia climate change in the U.S. https://en.wikipedia.org/ wiki/Climate_change_in_the_United_States#/ media/File:California_Drought_Dry_Lakebed_2009.jpg public domain
[1]
World Economic Forum. (Aug. 12, 2022). Droughts are getting worse around the world, here's why and what needs to be done.
https://www.weforum.org/agenda/2022/08/drought-water-climate-un /#:~:text=%3A%20Drought.Gov.-,Drought%20
frequency%20and%20duration%20has%20increased%20by%20nearly%20 a%20third,are%20currently%20facing%20 water%20stress.
[2]
United Nations. (May 12, 2022). World 'at a crossroads' as droughts increase nearly a third in a generation.
https://news.un.org/en/story/2022/05/1118142#:~ :text=And%20from%201998%20to%202017,to %20severe%20and%20prolonged%20droughts.
[3]
Algur, K. D., Patel, S. K., & Chauhan, S. (2021). The impact of drought on the health and livelihoods of women and children in India: A systematic review.
Children and Youth Services Review, Elsevier, 122(C).
https://ideas.repec.org/a/eee/cysrev/v122y2021ics0190740920323318.html
[4]
Schonhardt, S. (May 10, 2022). Scientific American.
https://www.scientificamerican.com/article/women-bear-the-brunt-of-drought-shocks/
[5]
King-Okumu, C., et al. (2019). How can we stop the slow-burning systemic fuse of loss and damage due to land degradation and drought in Africa?
Current Opinion in Environmental Sustainability, 50, pp. 289-302.
https://www.sciencedirect.com/science/article/pii/S1877343521000658
[6]
WRI. (2017). Can we restore 350 million hectares by 2030?
https://www.wri.org/insights/can-we-restore-350-million-hectares-2030
[7]
Vizcarra, N. (Sep. 10, 2020). Africa's great green wall is officially 4% - and unofficially 18% - complete. Global Landscapes Forum: Landscape News.
https://news.globallandscapesforum.org/46781/the-great-green-wall-is-officially-4-and-unofficially-18-complete/
[8]
Quesnel, K. J., & Ajami, N. K. (Oct. 25, 2017). ScienceAdvances.
https://www.science.org/doi/full/10.1126/sciadv.1700784
What is the source of the Ganges River?
[9]
Hoegh-Guldberg, O., et al. (2018).
Impacts of 1.5oC global warming on natural and human systems. In V. Masson-Delmotte, et a., (Eds.), Global warming of 1.5oC:
An IPCC special report on the impacts of global warming of 1.5oC above pre-industrial levels and related global
greenhouse gas emission pathways, in the context of strengthening the global response to the threat of climate change.
World Meteorological Organization Technical Document.
https://www.ipcc.ch/sr15/
[10]
Tsegai, D. & Brüntrup, M. (2019). Drought challenges and policy options: lessons drawn, and the way forward.
Current Directions in Water Scarcity Research, 2, pp. 325-336. Elsevier.
https://www.sciencedirect.com/science/article/abs/pii/B9780128148204000225
[11]
FAO & NEPAD. (Sep. 29, 2021). Review of forest and landscape restoration in Africa 2021. ReliefWeb.
https://reliefweb.int/report/world/review-forest-and-landscape-restoration-africa-2021#:~:text= The%20Review%20of%20Forest%20and,across%20the%20continent%20in%20restoring
What form of water is captured in large nets in dry climates?
[12]
Stocker, B. D. et al. (Mar. 11, 2019). Drought impacts on terrestrial primary production underestimated by satellite monitoring. Nature Geoscience, 12(4), pp. 264-270.
https://www.nature.com/articles/s41561-019-0318-6
[13]
Nath, S., Shyanti, R. K., & Nath, Y. (2021). Influence of anthropocene climate change on biodiversity loss in different ecosystems.
Global Climate Change, pp. 63-78. Elsevier.
https://www.sciencedirect.com/science/article/pii/B9780128229286000010
[14]
Peace, N. (Mar. 11, 2020). Impact of climate change on insect, pest, disease, and animal biodiversity.
International Journal Environmental Science & Natural Resources Review article, 23(5).
https://juniperpublishers.com/ijesnr/pdf/IJESNR.MS.ID.556123.pdf
[15]
Wintle, B. A., Legge, S., & Woinarski, J. C. (2020). After the megafires: What next for Australian wildlife? Trends in Ecology & Evolution, 35(9), pp. 753-757.
https://www.sciencedirect.com/science/article/pii/S0169534720301713
[16]
Brando, P.M., et al. (2020). The gathering firestorm in southern Amazonia. Science Advances, 6(2).
https://www.science.org/doi/10.1126/sciadv.aay1632
What four elements are involved in acid rain production?
[17]
Zhong, R. (Oct. 18, 2022). They're 'world champions' of banishing water. Now, the Dutch need to keep it. The New York Times.
https://www.nytimes.com/2022/10/10/climate/netherlands-drought-climate-change.html?campaign_id=54 &emc=edit_clim_20221011&instance_id=74326&nl=climate-forward®i_id=75304528&segment_id=109653&te=1&user_id=41c41844ba6d41e6e92a0dd7bae484d3
Floods
Flooded New Orleans after hurricane Katrina
NOAA Sep. 11, 2005
Wikipedia flood https://en.wikipedia.org/ wiki/Flood#/media/File: Katrina-new-orleans-flooding3-2005.jpg public domain
Humans continue to burn fossil fuels, increasing atmospheric greenhouse gases and atmospheric temperatures.
Hot air holds more water vapor, causing an increase in rainstorm intensity.[1]
According to the National Climate Assessment, rain intensity increased significantly between 1958 and 2016.
For each Celsius degree increase in Earth's temperature, the amount of atmospheric water vapor increases by around 7%.[1]
Floods occur when a lot of rain falls quickly and cannot soak into the ground because of saturation or
impermeability.not allowing liquid or gas to go through
Water pools on land surfaces or flows downhill, creating destructive and often deadly flash floods.[1]
Floods alter landscapes, erode riverbanks, increase sedimentation, clog rivers, displace and smother fish and other aquatic life
when their habitats are washed away.[3]
Floodwater can be contaminated with agricultural pesticides, industrial chemicals, debris and sewage.
Floods are the primary cause of weather-related infectious disease outbreaks, increasing the chance of spreading waterborne diseases
including
hepatitis Aa highly contagious liver infection caused by the hepatitis A virus
and
cholera.an intestinal infection caused by Vibrio cholerae bacteria[3]
Receding floodwater creates stagnant water pools leaving a breeding ground for mosquitoes, which can transmit
malaria.a serious and sometimes fatal disease caused by a mosquito parasite
Flood events also lead to an increase in some forms of
zoonosisa disease which can be transmitted to humans from animals,
such as
leptospirosisan infectious bacterial disease that occurs in rodents, dogs, and other mammals and can be transmitted to humans.[3]
Researchers calculated that floods also affect the U.S. housing market.
They found that residential properties at risk of flooding were overvalued by between $121 billion and $127 billion.
Most were found in coastal counties with no flood risk disclosure laws, in those where there was little concern about climate change, in low-income communities and
in cities and towns highly dependent on property taxes.[4]
SeaWiFS satellite image of Okawango Delta, with national borders added
NASA/Goddard Spaceflight Center Mar. 28, 1999
Wikipedia Okavango Delta https://en.wikipedia.org/ wiki/Okavango_Delta#/media/ File:DeltaOkawango.jpg public domain
The effects of seasonal floods isn't always negative.
Floods transport nutrients, including nitrogen, phosphorus and organic material.
When water recedes, the nutrients remain as natural fertilizer improving soil quality and increasing plant growth productivity.
Ancient civilizations rose near productive, seasonally-flooded rivers such as the Nile.[3]
Floods replenish underground water sources.
Floodwater is absorbed by the ground, percolating through soil and rock, reaching underground aquifers, which supply clean fresh water to springs,
wells, lakes and rivers.[3]
Small seasonal floods help native fish outcompete invasive species.
Sediment deposited during floods serves as fish nurseries for small fish, and the nutrients they bring support aquatic food webs by boosting productivity.[3]
Approximately 40% of world species rely on wetlands, which filter water, mitigate flooding and act as carbon sinks.
The Okavango Delta in Botswana is a
UNESCO World Heritage Site
and one of the world's largest, most important wetland habitats.
The river captures rainfall from the Angolan highlands, causing flooding that replenishes wetlands during the dry season,
providing a Kalahari Desert oasis.[3]
Floods can trigger breeding events and migration.
In 2016, thousands of water birds flocked to the Macquarie Marshes in New South Wales, Australia.
Flooding had filled their wetland habitat for the first time in years, triggering a mass breeding event.[3]
In Cambodia, monsoon rains cause the annual Mekong River flood pulse migration.
The floodwaters caused the Tonle Sap river, connecting to the Mekong River to Tonle Sap lake, to reverse its flow.
Floodwater entering the lake starts fish migrations, supporting one of the world's most productive fisheries.[3]
The Macquarie marshes are an important area for white-necked herons G. Fergus Jul. 14, 2006
Wikipedia Macquarie Marshes https://en.wikipedia.org/ wiki/Macquarie_Marshes#/ media/File:Pacific_Heron.jpg CC BY-SA 2.5
River floods occur when a river or stream overflows its banks onto normally dry land.
This type of flood is most common in late winter and early spring as the result of heavy rainfall, rapid snow melt or ice jams.
Approximately 41 million U.S. residents are at risk from flooding along rivers and streams.[2]
Coastal flooding results from coastal storms, including hurricanes or
nor'eastersa storm that travels along the Eastern Seaboard and brings winds from the northeast
that create destructive storm surges, walls of water moving from ocean onto land.[2]
Higher sea level produces shallow floods known as nuisance or sunny day floods.
These floods wash over roads and into storm drains during high tide.[2]
Urban flooding refers to flooding that occurs when rainfall, rather than a body of water, exceeds stormwater drain capacity,
usually in densely populated areas.[2]
Because the National Weather Service issues flood watches and warnings, local weather services can notify citizens and the media.[1]
Flooding can be mitigated by undeveloped land areas, forests, wetlands and retention ponds.[1]
Sources:
[1]
Hersher, R. (Aug. 3, 2022). How climate change drives inland floods. NPR.
https://www.npr.org/2022/08/03/1115384628/how-climate-change -drives-inland-floods#:~:text=Climate%20change%20 means%20more%20flood,mean%20more%20inland%20flood%20risk%3F
[2]
Denchak, M. (Apr. 10, 2019). Flooding and climate change: Everything you need to know. NRDC.
https://www.nrdc.org/stories/flooding-and-climate-change-everything-you-need-know
[3]
National Geographic. (2022). The many effects of flooding.
https://education.nationalgeographic.org/resource/many-effects-flooding
[4]
Gourevitch, J. D., et al. (Feb. 16, 2023). Unpriced climate risk and the potential consequences of overvaluation in US housing markets. Nature.
https://www.nature.com/articles/s41558-023-01594-8
Resources
Boulton, C.A., Lenton, T.M., & Boers, N. (2022). Pronounced loss of Amazon rainforest resilience since the early 2000s. Nature Climate Change, 12, 271-278.
https://www.nature.com/articles/s41558-022-01287-8"
Tonlé Sap lake, river and drainage basin in Cambodia Mkummu Oct. 2, 2006
Wikipedia Macquarie Marshes https://en.wikipedia.org/ wiki/Tonl%C3%A9_Sap#/ media/File:TonleSapMap.png CC BY-SA 2.5
Chea, T., Berger, N., & Edelson, J. (Apr. 6, 2023). Dramatic photos show how storms filled California reservoirs. AP News.
https://apnews.com/article/california-reservoir-levels-winter-storms-da455706e614b95fb49d98a211f788d3
Colorado River District. (2020). Acronyms.
https://www.coloradoriverdistrict.org/acronyms/
Colorado River District. (2020). Glossary.
https://www.coloradoriverdistrict.org/glossary/
Colorado River District. (2020). Webinars.
https://www.coloradoriverdistrict.org/events-directory/webinars/
Cooper, K. (Jul. 27, 2023). Ocean current system could shut down as early as 2025, leading to climate disaster. Space.com.
https://www.space.com/ocean-current-system-shut-down-2025-climate-disaster?utm_term=49331890-489B-422D-BE22-6D587467AE8C&utm_campaign=58E4DE65-C57F-4CD3-9A5A-609994E2C5A9&utm_medium=email&utm_content=D81D6063-ABE5-4202-89F7-A135311B1A2E&utm_source=SmartBrief
Environmental Protection Agency. (Apr. 4, 2023). Annual allotment of federal funds for states, tribes, and territories.
https://www.epa.gov/dwsrf/annual-allotment-federal-funds-states-tribes-and-territories#:~:text=The%20allotment%20to%20tribes%20and,national%20 reserved%20programs%20are%20made.
Environmental Protection Agency. (Feb. 18, 2022). Drinking water rule quick reference guides.
https://www.epa.gov/dwreginfo/drinking-water-rule-quick-reference-guides
Environmental Protection Agency. (Feb. 18, 2022). Regulatory and guidance information by topic: Water.
https://www.epa.gov/regulatory-information-topic/regulatory-and-guidance-information-topic-water
Environmental Protection Agency. (Feb. 23, 2016). Water trivia facts.
https://www3.epa.gov/safewater/kids/water_trivia_facts.html
What is the smallest ocean?
Floodbase. (2023). Global flood database.
http://global-flood-database.cloudtostreet.info/
Hillhouse, G. (May 3, 2022). How wells and aquifers actually work. Practical Engineering.
https://practical.engineering/blog/2022/5/2/how-wells-amp-aquifers-actually-work
Hillhouse, G. (Apr. 5, 2022). What sewage treatment and brewing have in common. Practical Engineering.
https://practical.engineering/blog/2022/4/5/what-sewage-treatment-and-brewing-have-in-common
Hofschneider, A. (Aug. 28, 2024). Alaska's permafrost is thawing, releasing a concerning amount of mercury. High Country News.
https://www.hcn.org/articles/alaskas-permafrost-is-thawing-releasing-a-concerning-amount-of-mercury/
Horne, C. et al. (2017). Water for the environment. Elsevier Press.
https://www.sciencedirect.com/book/9780128039076/water-for-the-environment
Hubler, S. (Jun. 25, 2023). A vast lake has captivated California where farms stood a year ago. The New York Times.
https://www.nytimes.com/2023/06/25/us/california-storms-tulare-lake.html?campaign_id=190&emc=edit_ufn_20230716&instance_id=97674&nl=from-the-times®i_id=75304528&segment_id=139475&te=1&user_id=41c41844ba6d41e6e92a0dd7bae484d3
MarineBio.org. (2020). Marine life.
https://marinebio.org/creatures/facts/
McDonald, M. (Feb. 15, 2024). A new study revealed big underestimates of Greenland ice loss - and the power of new technologies to track the changes. Inside Climate News.
https://insideclimatenews.org/news/15022024/new-study-revealed-big-underestimates-of-greenland-ice-loss/
Mesa, N. (Apr. 19, 2024). When dams come down, what happens to the ocean? High Country News.
https://www.hcn.org/articles/when-dams-come-down-what-happens-to-the-ocean/?utm_source=wcn1&utm_medium=email&utm_campaign=2024-04-19-Newsletter
When was the International Geophysical Year?
Miller, C. (Nov. 28, 2022). Water as part of the climate solution. Inside Climate News.
https://insideclimatenews.org/news/28112022/water-climate-solution/#:~:text=Hydropower%20 is%20a%20vital%20source,which%20need%20freshwater%20for%20cooling.
Myskow, W. (Apr. 17, 2024). How a tiny inland shorebird could help save the Great Salt Lake. Inside Climate News.
https://insideclimatenews.org/news/17042024/tiny-inland-shorebird-could-save-great-salt-lake/
NASA. (Aug. 28, 2015). NASA's earth minute: Greenland ice.
https://www.youtube.com/watch?v=yLm7PSsvW8g
Newburger, E. (Dec. 30, 2022). EPA issues clean water rule that repeals Trump administration changes. CNBC.
https://www.cnbc.com/2022/12/30/epa-issues-clean-water-rule-that-repeals-trump-administration-changes.html?utm_campaign=Hot%20News&utm_ medium=email&_hsmi=240196476&_hsenc=p2ANqtz-9IKSDO5Og-udYTTiUkS-onImrPDW0PyM2UaiQClmjJLJLWucmxmu8V89VCHw1FLeL1BzIKSPwdAqN1Mz1W7NNnbLD0nw&utm_content= 240196476&utm_source=hs_email
NPR. (Apr. 19, 2023). How melting ice due to climate change is having far reaching effects.
https://apps.npr.org/arctic-ice-melting-climate-change/
Person, D. (Jan. 31, 2024). El Niño - and why the polar vortex and MJO (not to be confused with mojo) matter. Know Your Water News.
https://knowyourwaternews.com/el-nino-and-why-the-polar-vortex-and-mjo-not-to-be-confused-with-mojo-matter/
Groundwater USGS Rivers, Streams and Creeks
https://www.usgs.gov/special-topic/water-science -school/science/rivers-streams-and-creeks? qt-science_center_objects=0#qt-science_center_objects public domain
Rayne, E. (Dec. 20, 2022). Megadrought on Earth affected gravity waves at the edge of space. Space.com
https://www.space.com/drought-on-earth-affects-space-gravity-waves
Richtel, M. (Jan. 18, 2023). Bomb cyclone? Or just windy with a chance of hyperbole? The New York Times.
https://www.nytimes.com/2023/01/18/science/weather-forecasts-language.html?unlocked_article_code=ztt_jXvLJHQ2MhY3WyJz WS9BU3DPAGoB6b_SrLxBmG_MbP8fBvakVh6db3QrVFiHqh2ORc__ BOE49mAtzMSZVJdw765KcjrwtjVQ_VOTZRTB90vElrUmjzVRINM-oPM_wKZkIMBWic82CLko_bafj8BLmGZykTy5Fz7ttnhj2t6 DMKxfkI5KYJuYL2SEQfacDJiR-4XrOLUuj2qzy7isqm-MhvoVwillHemS2hxw0LD0ZUXjLDPXLZWF1CgD0nc5cXMo8wL2 erPcqmKSekeCS2tT4iuolgqXRID8C9rvox1IhJcJJvJAejaU_CFXHs-Z6ZGbHiaIKpeHEx-M0HQ3fwr_WWsF&smid=share-url
Seametrics. (2018). 100 amazing water facts you should know.
https://www.seametrics.com/blog/water-facts/
Singh, P. (Feb. 2, 2023). Relative humidity calculator.
https://www.omnicalculator.com/physics/relative-humidity
Smithsonian Institution. (Apr. 2018). The census of marine life.
https://ocean.si.edu/ecosystems/census-marine-life/census-marine-life-overview
World`s most important water use?
Sommer, L. (Jun. 9, 2021). The drought in the western U.S. is getting bad. Climate change is making it worse. NPR.
https://www.npr.org/2021/06/09/1003424717/the-drought-in-the-western-u-s-is-getting-bad-climate-change-is-making-it-worse
Tabuchi, H. (Jul. 26, 2023). 101oF in the ocean off Florida: Was it a world record? The New York Times.
https://www.nytimes.com/2023/07/26/climate/florida-100-degree-water.html?campaign_id=54&emc=edit_clim_20230727&instance_id=98609&nl=climate-forward®i_id=75304528&segment_id=140460&te=1&user_id=41c41844ba6d41e6e92a0dd7bae484d3
Tollefson, J. (Dec. 16, 2022). Billion-dollar NASA satellite launches to track Earth's water. Nature.
https://www.nature.com/articles/d41586-022-04455-0#:~:text=The%20US%241.2%2Dbillion%20 Surface,lens%20on%20a%20warming%20world.
UCI News. (Feb, 23, 2023). UC Irvine researchers create e. coli-based water monitoring technology.
https://news.uci.edu/2023/02/23/uc-irvine-researchers-create-e-coli-based-water-monitoring-technology/
United States Department of Agriculture. (Aug. 2, 2022). Biden Administration Launches USDA-EPA Partnership to Provide Wastewater Sanitation to Underserved Communities.
https://www.usda.gov/media/press-releases/2022/08/02/biden-administration-launches-usda-epa-partnership-provide#:~:text=EPA%20and%20USDA%20will%20jointly,harmful%20exposure%20to%20backyard%20sewage.
Utah Division of Water Rights. (n. d.). Glossary of water words.
https://www.waterrights.utah.gov/wrinfo/glossary.asp
What is the major source of acid rain?
Utah Geological Survey. (n. d.). Groundwater resources/hydrology publications.
https://geology.utah.gov/resources/ groundwater/groundwater-resources/
Utah State University. (n. d.). Utah water research laboratory.
https://uwrl.usu.edu/water-resources/index
Water.org. (n. d.). Safe water protects and saves lives.
https://water.org/
Water Project. (Aug. 31, 2016). Facts about water: Statistics of the water crisis.
https://thewaterproject.org/water-scarcity/water_stats?gclid=CjwKCAjwlbr8BRA0EiwAnt4MThT9JC0YMyL3tdQOsA1dwk M9lUpMx8W8Us9AdqloKEcBY2ua8hSe9RoCONgQAvD_BwE
Water covers what percent of Earth`s surface?
WaterUseItWisely. (2020).
https://wateruseitwisely.com/
Wikipedia. (Oct. 16, 2020). Water.
https://en.wikipedia.org/wiki/Water
World Bank. (Feb. 3, 2023). What the future has in store: A new paradigm for water storage.
https://www.worldbank.org/en/topic/water/publication/what-the-future-has-in-store-a-new-paradigm-for-water-storage
Translate this page:
Denise Meeks, tucsonkosmicgirl@gmail.com
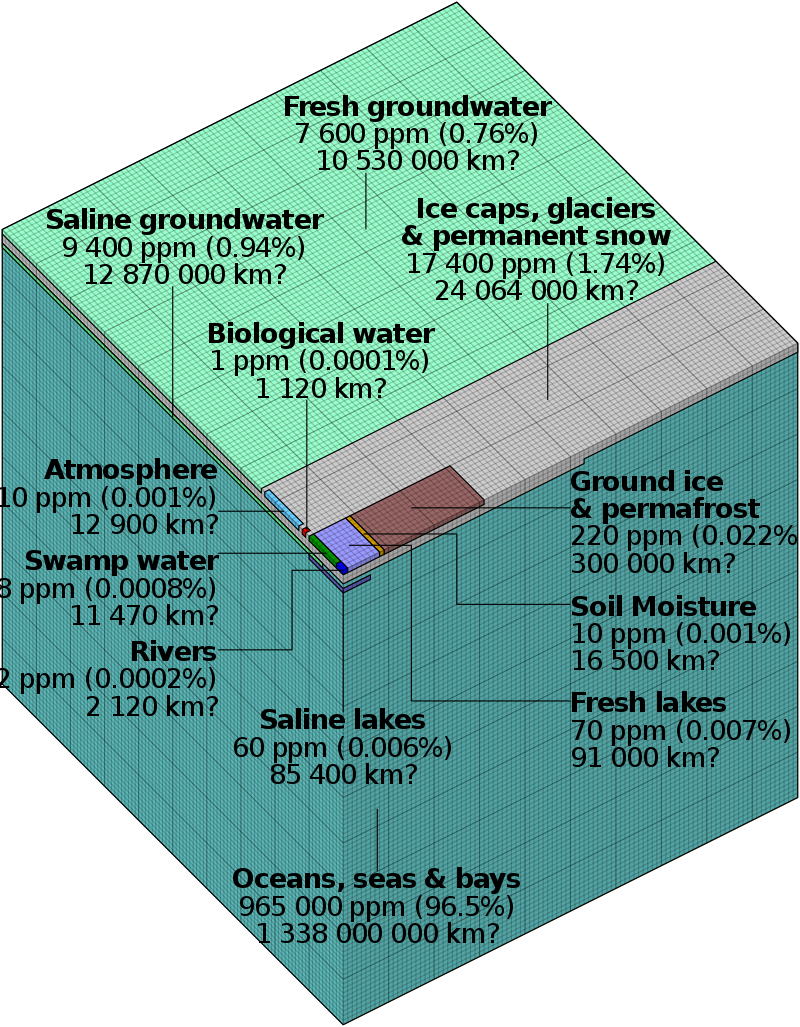
 Earth's water is stored and located above and below Earth's surface, and in the atmosphere.
More than 99% is contained in oceans, seas and bays, with small amounts in lakes, rivers and streams, with even smaller amounts hidden as
permafrostthick subsurface layer of soil that remains frozen throughout the year, usually in polar regions
and
as water vapor in the atmosphere.
Changes in water location, availability, temperature, purity and
salinitythe degree to which something is salty
can produce additional climate and weather changes, flooding, droughts, disruption in the natural balances of plants and animal species and the spread of diseases.
If all of Earth's water, located in oceans, icecaps and glaciers, lakes, rivers, groundwater and water in the atmosphere, were put into a sphere,
the diameter of that water ball would be about 860 miles (about 1,385 km), a little more than the distance between Salt Lake City, Utah and Topeka, Kansas.
The volume of all water would be about 332.5 miles3, or 1,386 km3.[1]
A mile3 of water equals more than 1.1 trillion gallons.
A km3 of water equals about 264 billion gallons, or 1 trillion liters.[1]
About 3,100 mile3 (12,900 km3) of water, mostly in the form of water vapor, is in the atmosphere.
If it all fell as precipitation at once, the Earth would be covered with only about 1 inch of water.[1]
Each day, the lower 48 U.S. states receive a total volume of about 4 mile3 (17.7 km3) of precipitation
and 280 mile3 (1,170 km3) of water evaporate or transpire into the atmosphere.[1]
If all of the world's water was poured on the contiguous U.S. states, it would cover the land to a depth of about 107 miles (145 km).[1]
Of the fresh water on Earth, more is stored in the ground than is available in rivers and lakes.
More than 2,000,000 mile3 (8,400,000 km3) of fresh water is stored in the Earth, most within one-half mile of the surface.
Most fresh water is stored in the 7,000,000 mile3 (29,200,000 km3) of glaciers and icecaps in the polar regions and in Greenland.[1]
Sources:
[1]
USGS. (n. d.). How much water is there on Earth?
https://www.usgs.gov/special-topics/
Earth's water is stored and located above and below Earth's surface, and in the atmosphere.
More than 99% is contained in oceans, seas and bays, with small amounts in lakes, rivers and streams, with even smaller amounts hidden as
permafrostthick subsurface layer of soil that remains frozen throughout the year, usually in polar regions
and
as water vapor in the atmosphere.
Changes in water location, availability, temperature, purity and
salinitythe degree to which something is salty
can produce additional climate and weather changes, flooding, droughts, disruption in the natural balances of plants and animal species and the spread of diseases.
If all of Earth's water, located in oceans, icecaps and glaciers, lakes, rivers, groundwater and water in the atmosphere, were put into a sphere,
the diameter of that water ball would be about 860 miles (about 1,385 km), a little more than the distance between Salt Lake City, Utah and Topeka, Kansas.
The volume of all water would be about 332.5 miles3, or 1,386 km3.[1]
A mile3 of water equals more than 1.1 trillion gallons.
A km3 of water equals about 264 billion gallons, or 1 trillion liters.[1]
About 3,100 mile3 (12,900 km3) of water, mostly in the form of water vapor, is in the atmosphere.
If it all fell as precipitation at once, the Earth would be covered with only about 1 inch of water.[1]
Each day, the lower 48 U.S. states receive a total volume of about 4 mile3 (17.7 km3) of precipitation
and 280 mile3 (1,170 km3) of water evaporate or transpire into the atmosphere.[1]
If all of the world's water was poured on the contiguous U.S. states, it would cover the land to a depth of about 107 miles (145 km).[1]
Of the fresh water on Earth, more is stored in the ground than is available in rivers and lakes.
More than 2,000,000 mile3 (8,400,000 km3) of fresh water is stored in the Earth, most within one-half mile of the surface.
Most fresh water is stored in the 7,000,000 mile3 (29,200,000 km3) of glaciers and icecaps in the polar regions and in Greenland.[1]
Sources:
[1]
USGS. (n. d.). How much water is there on Earth?
https://www.usgs.gov/special-topics/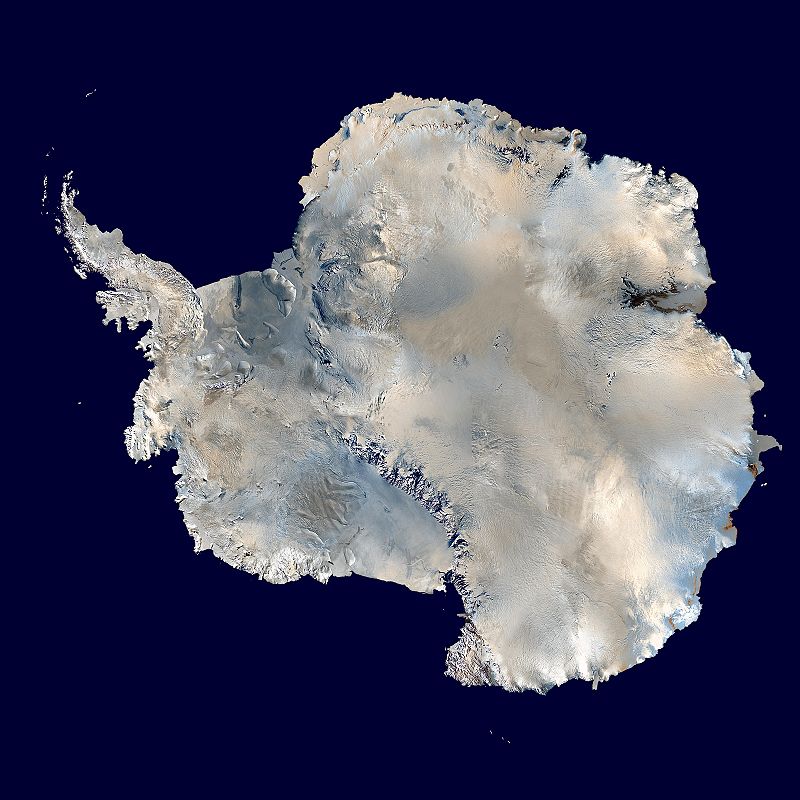
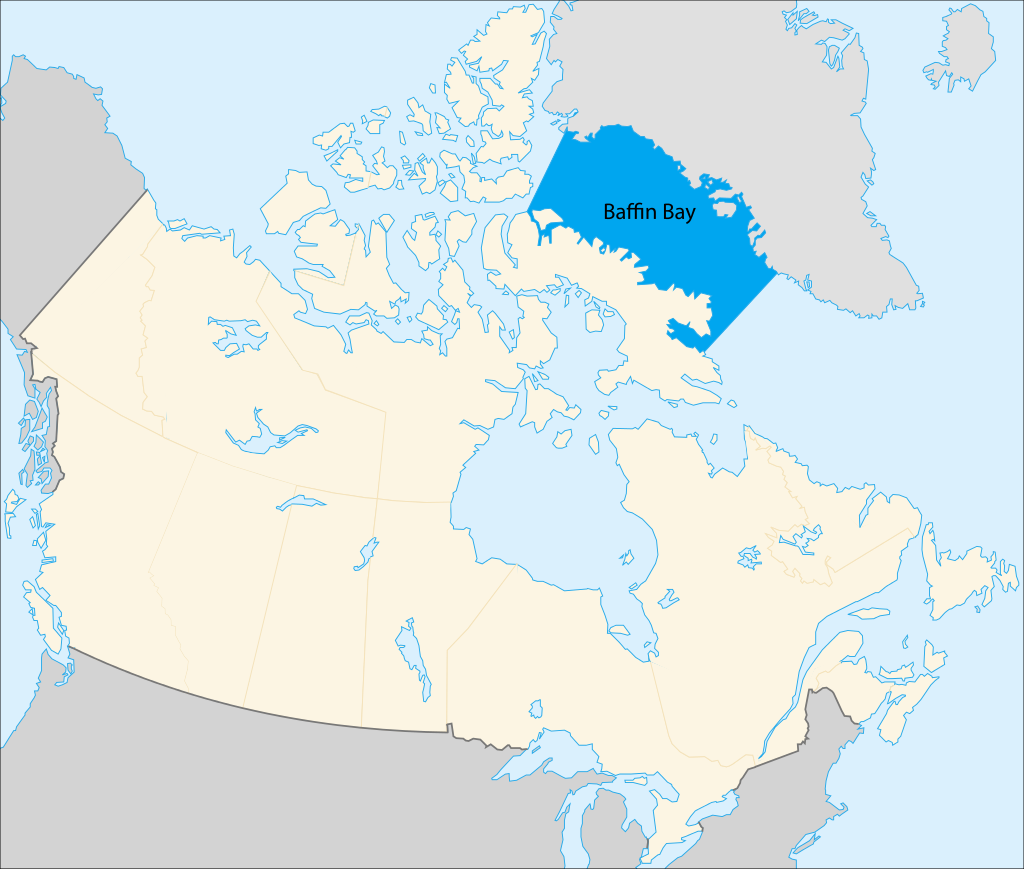
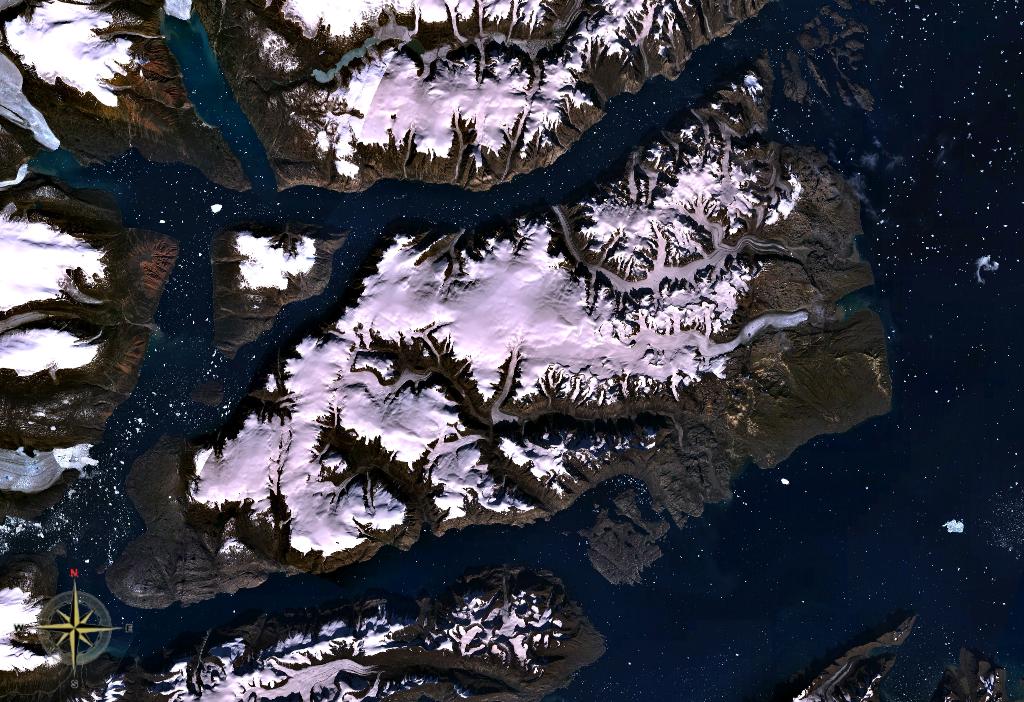
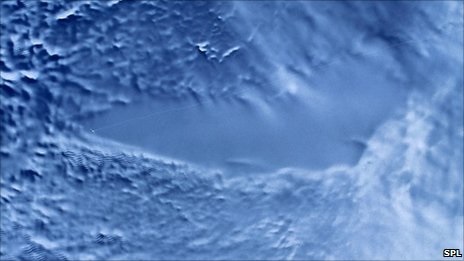
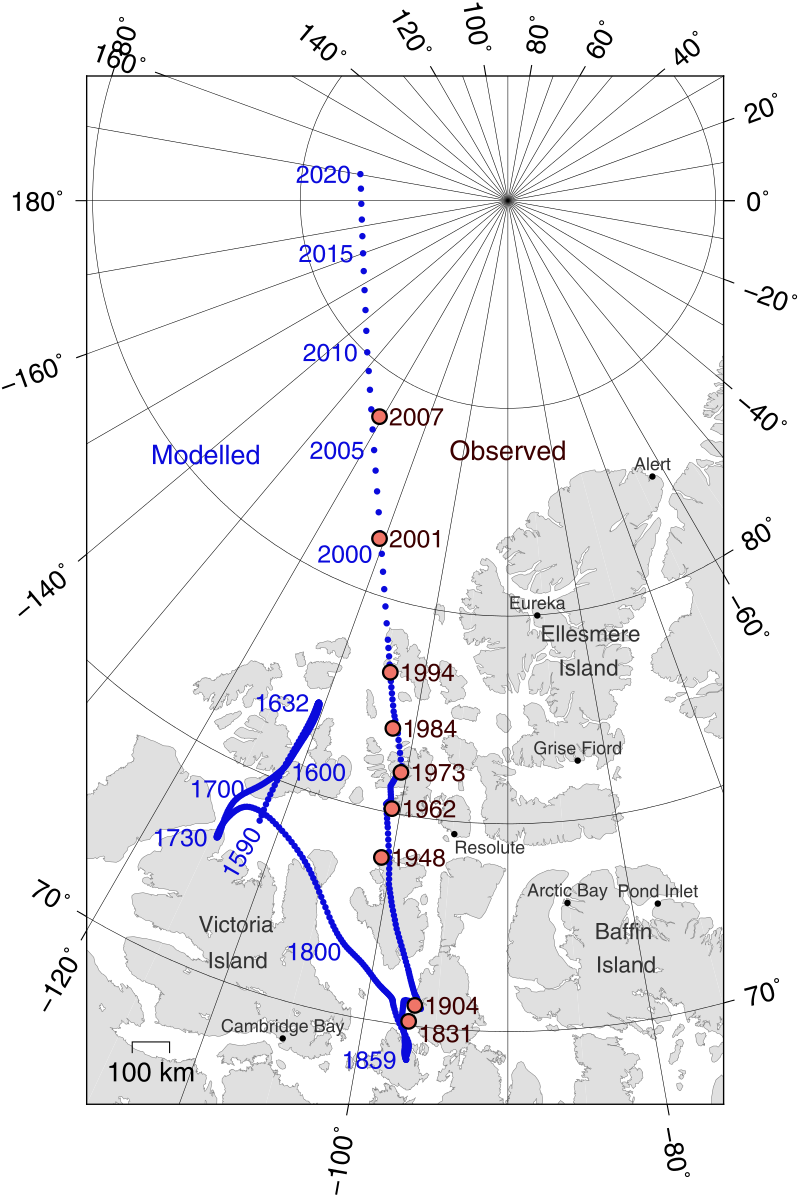
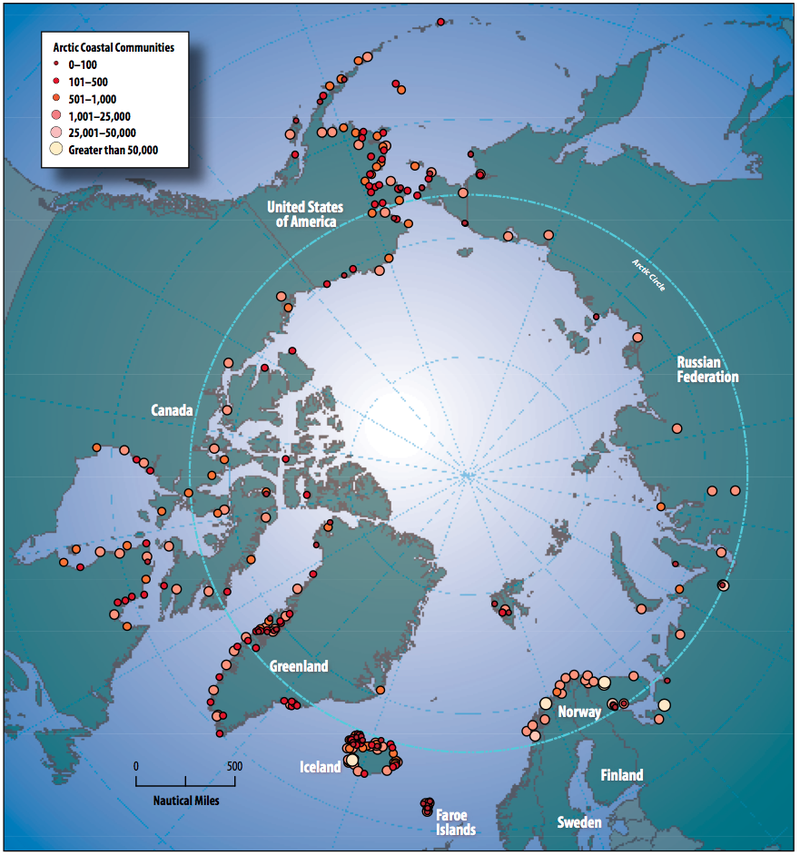
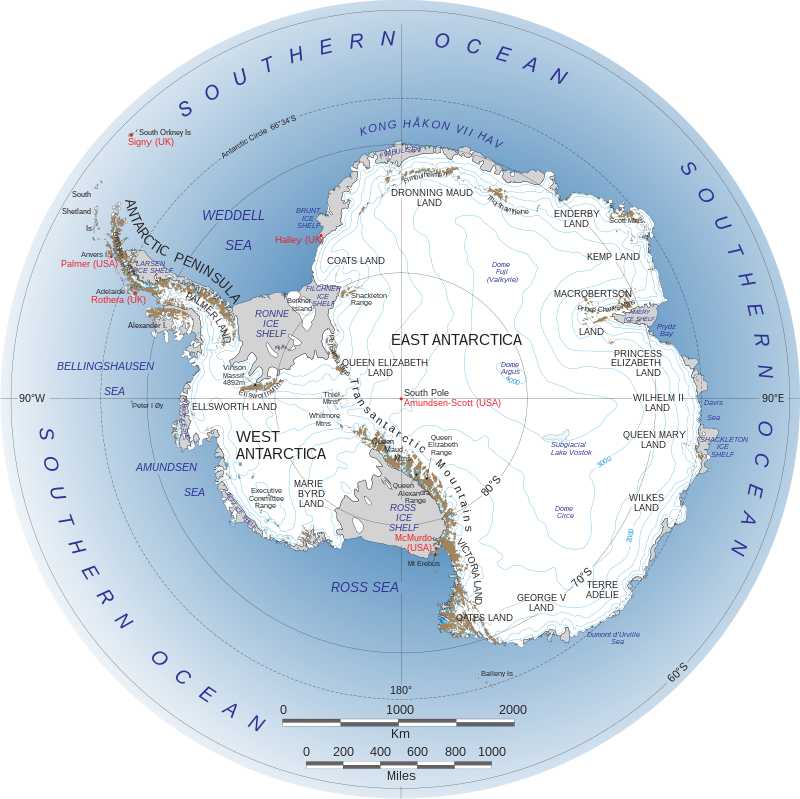
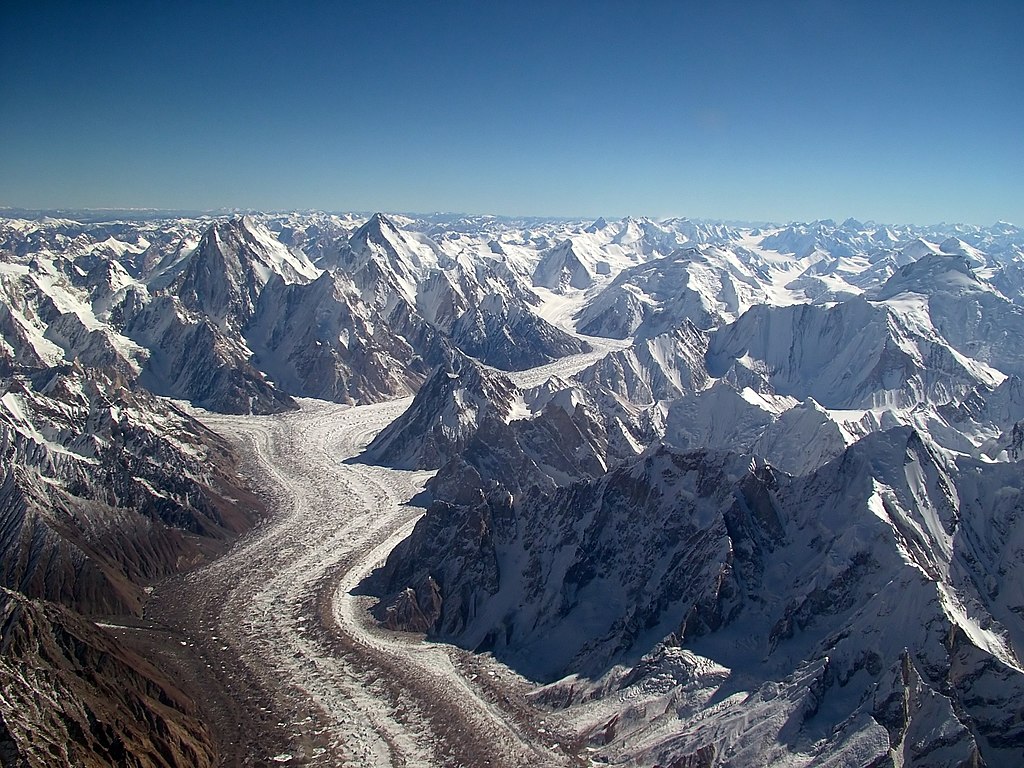
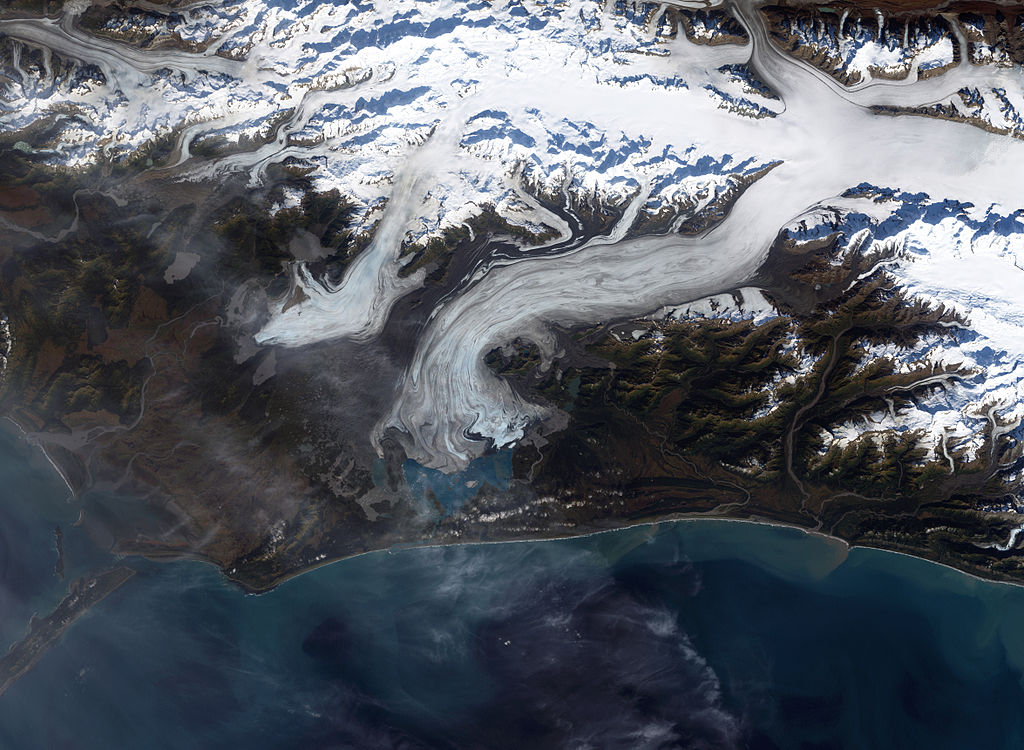
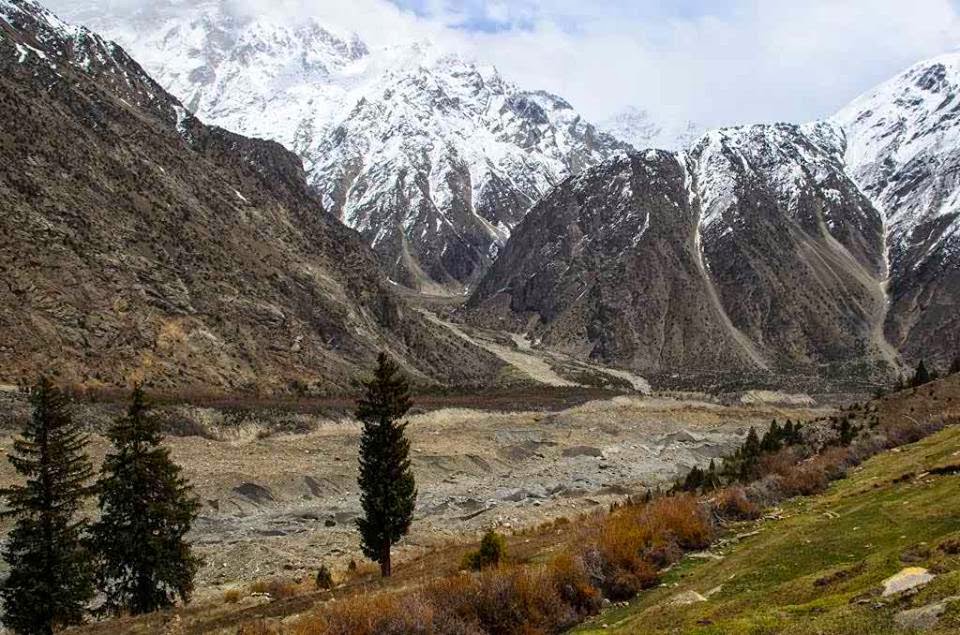
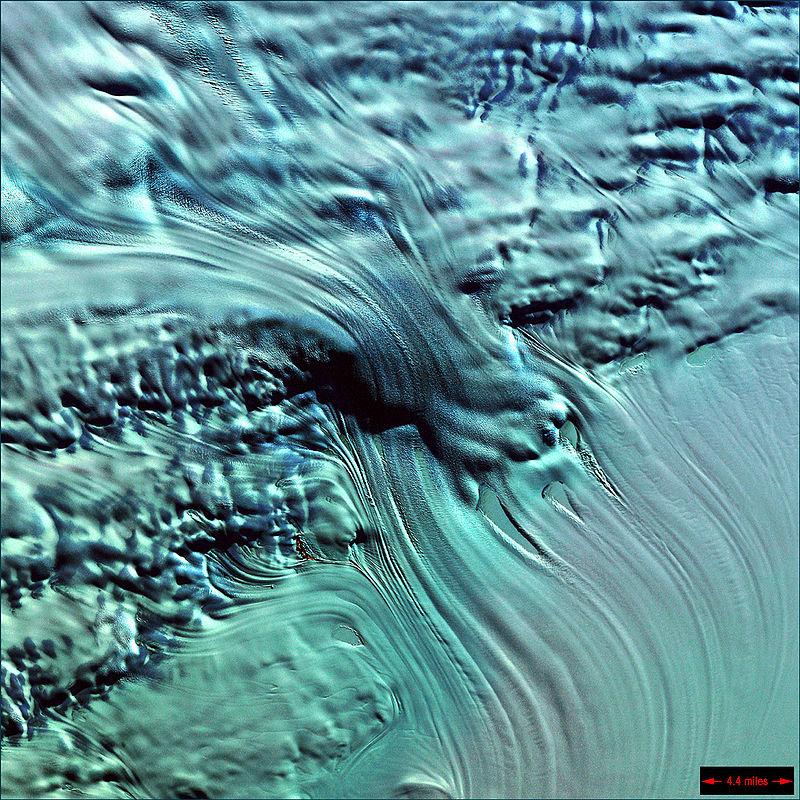
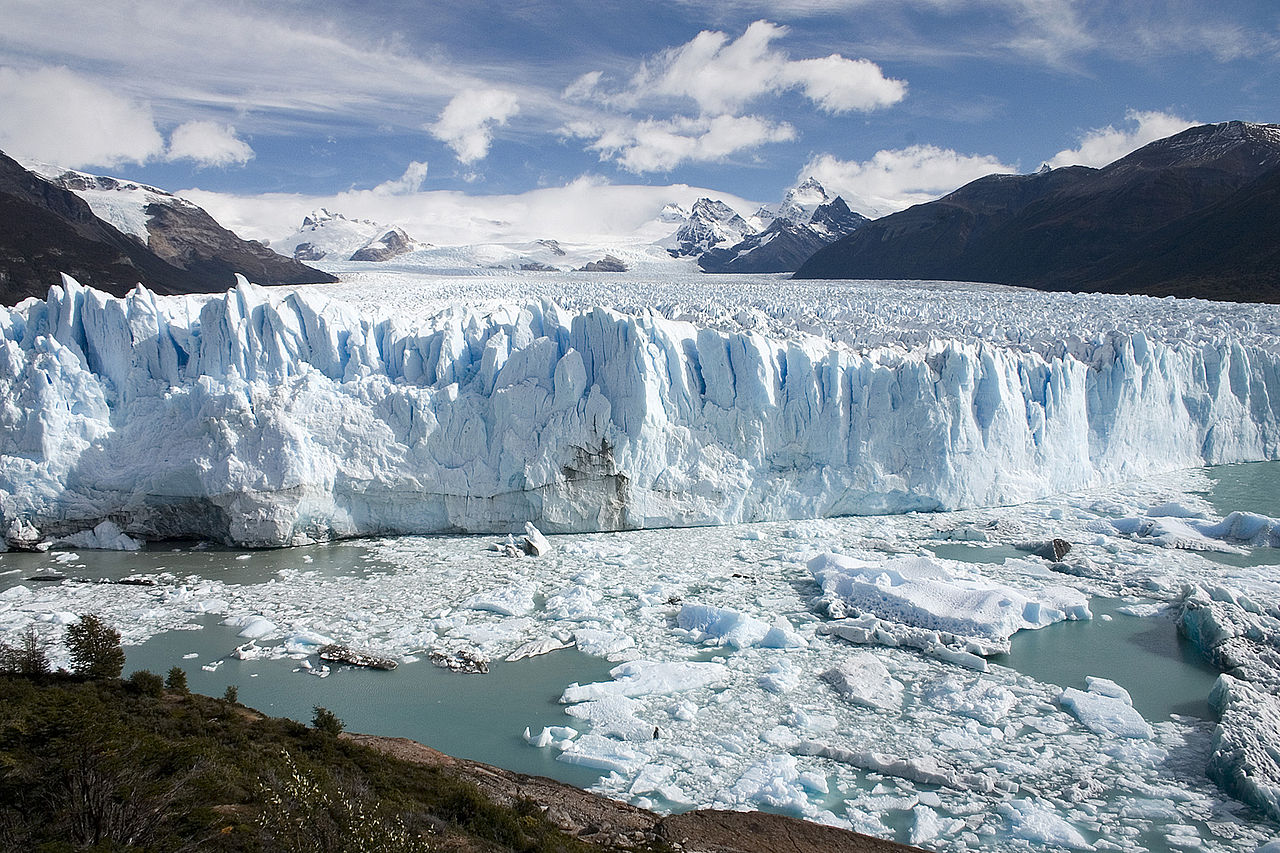
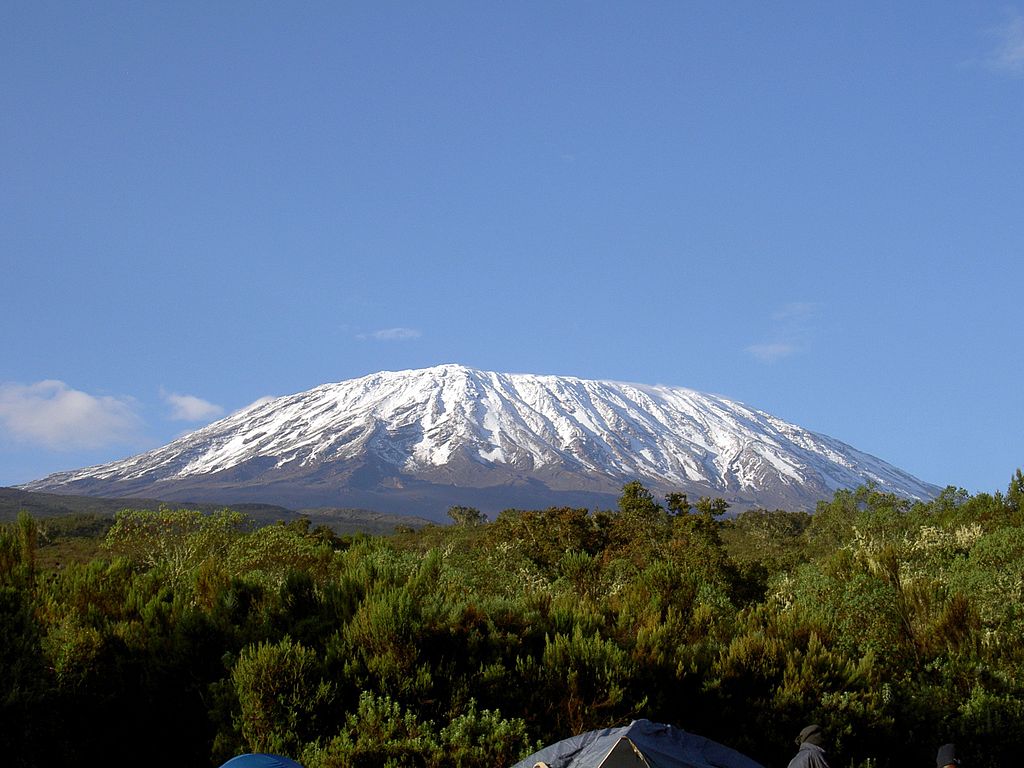
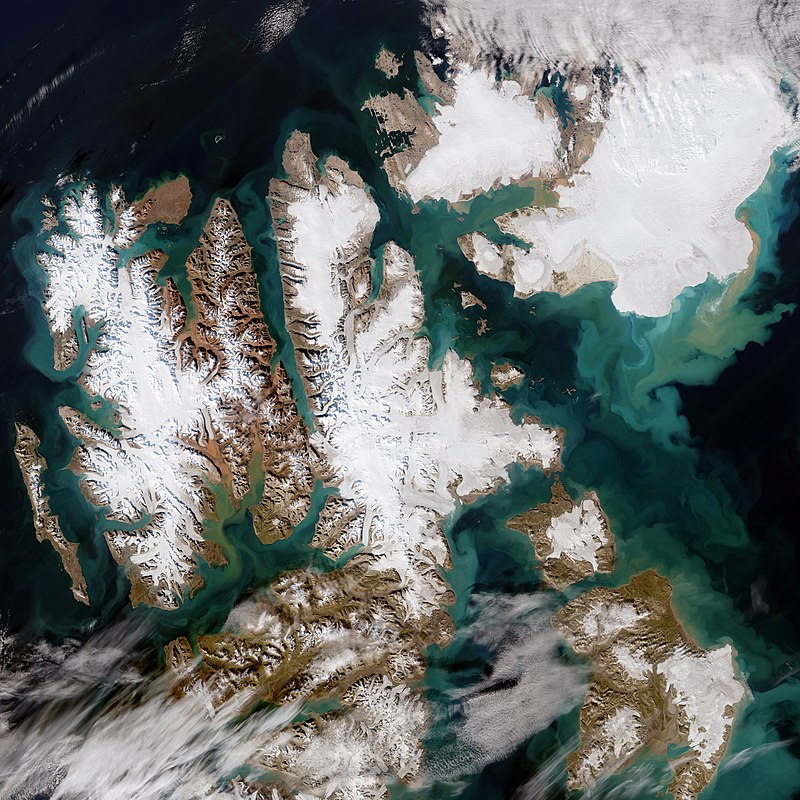
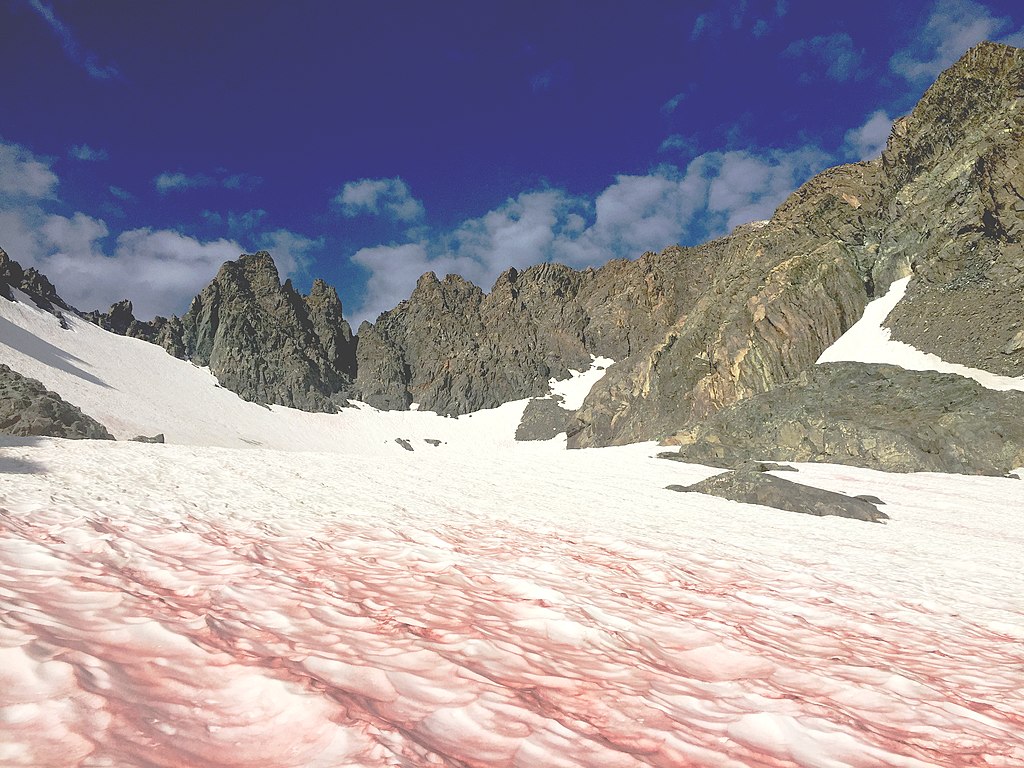
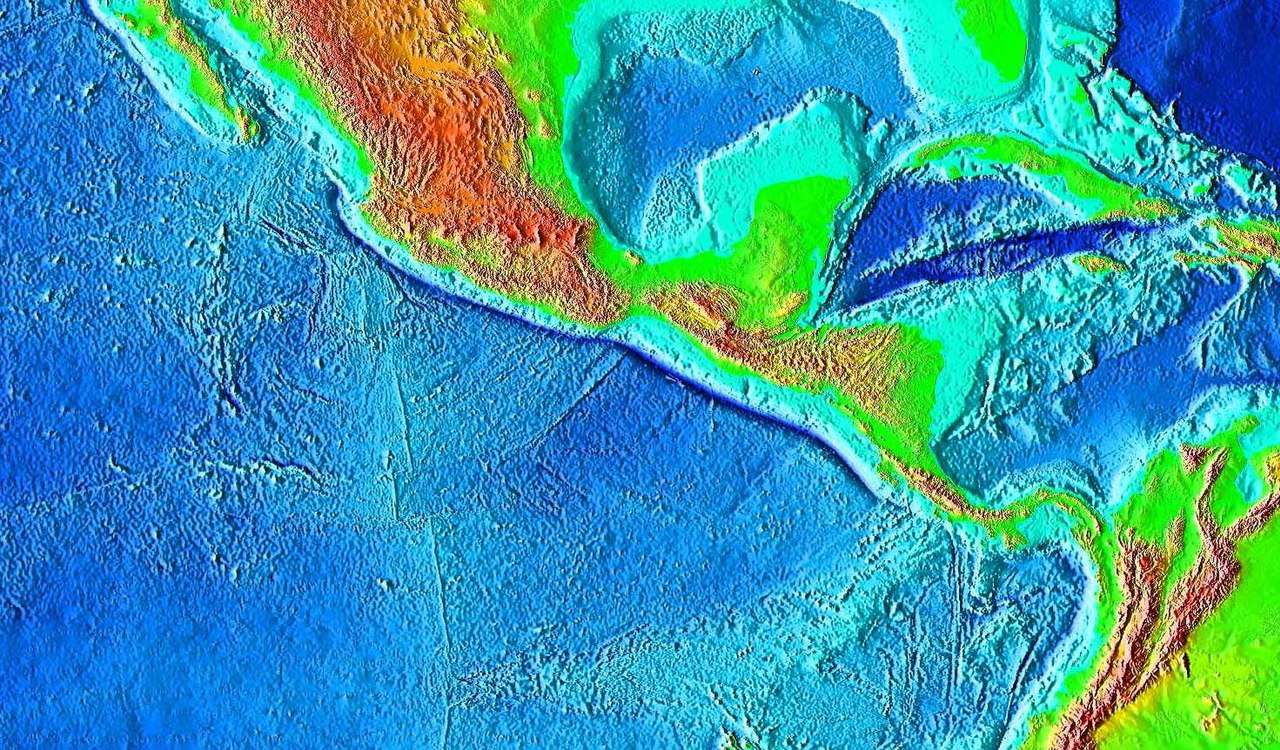
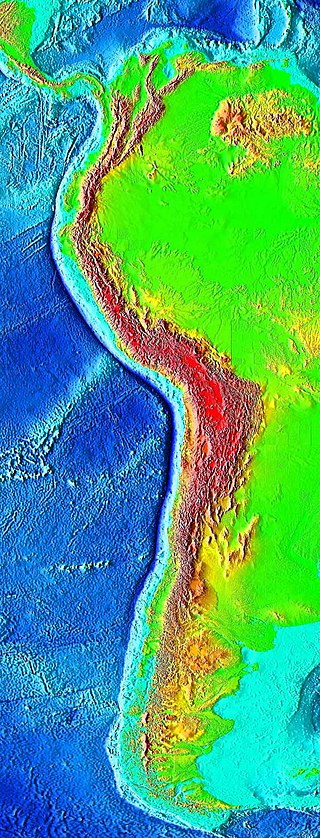
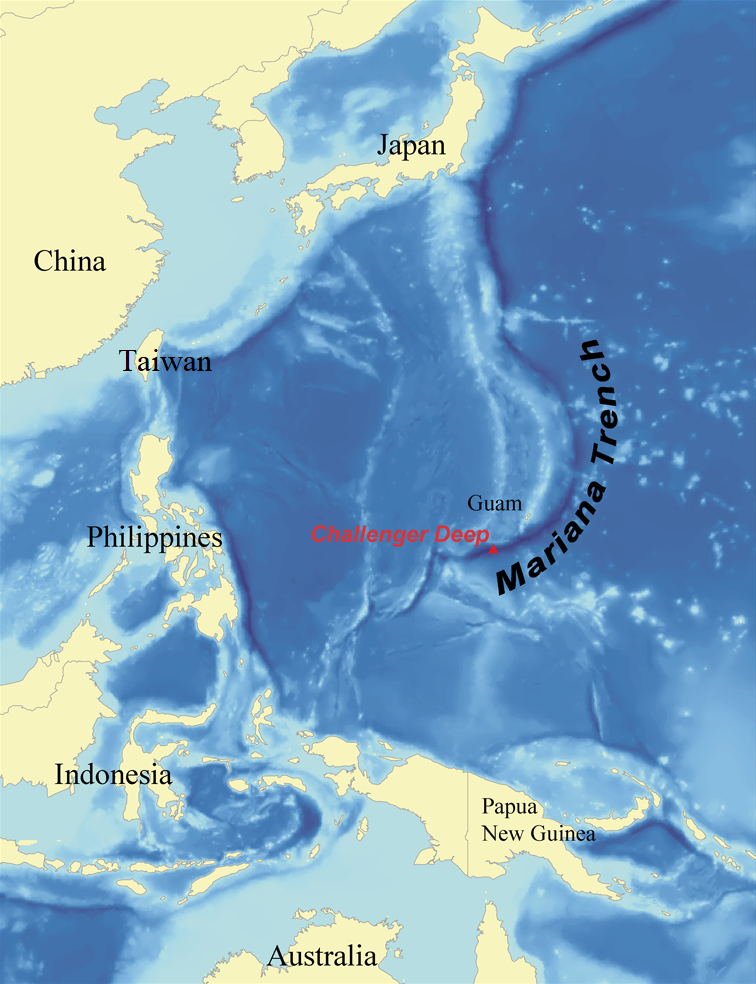
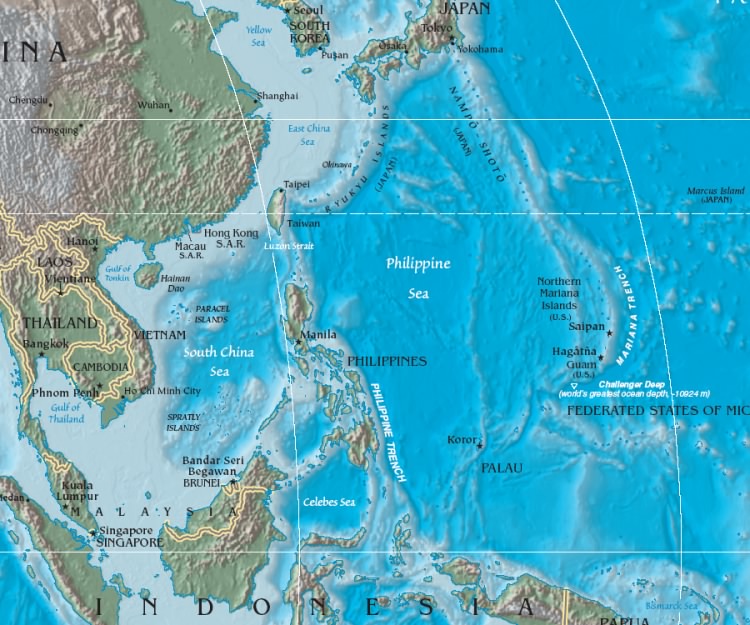
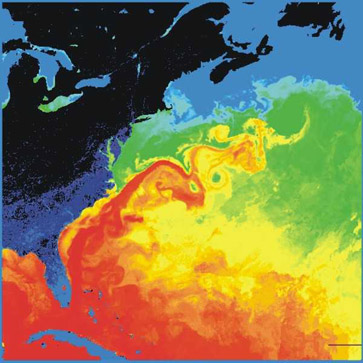

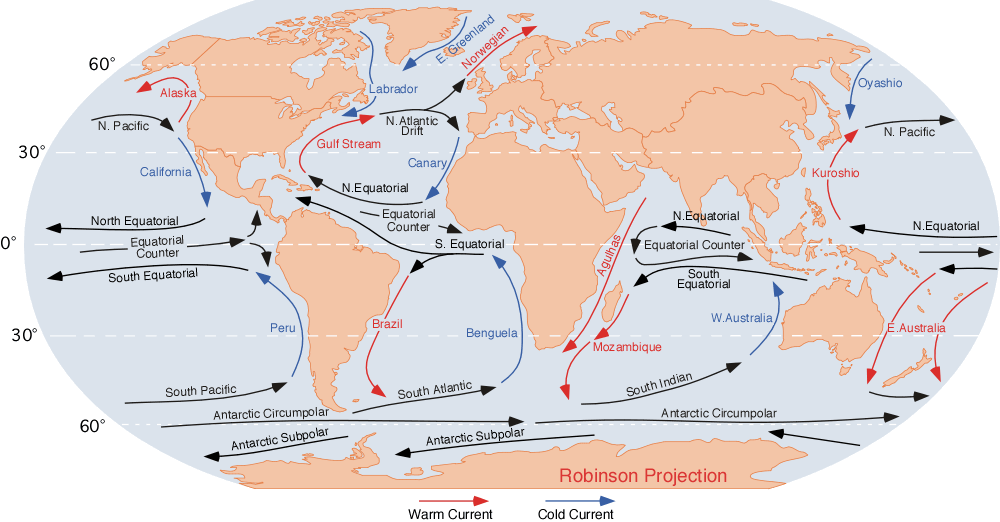
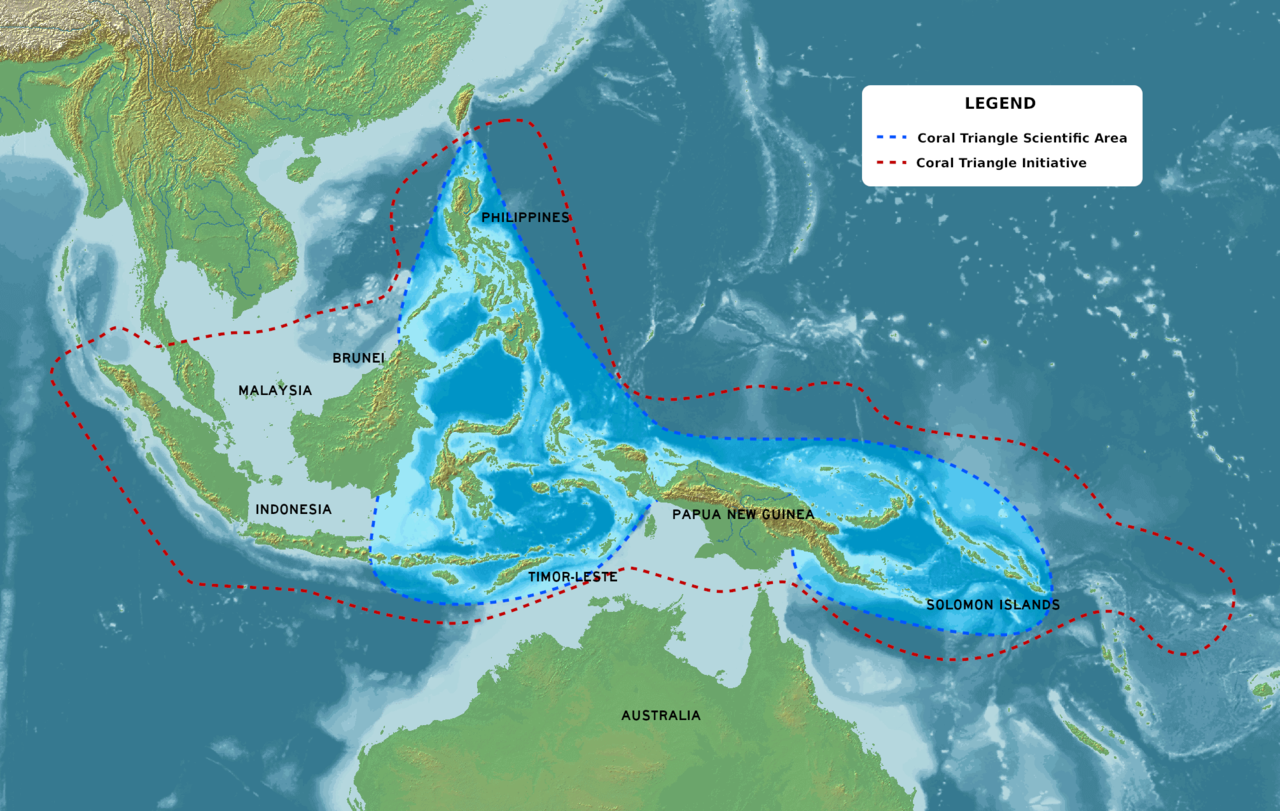
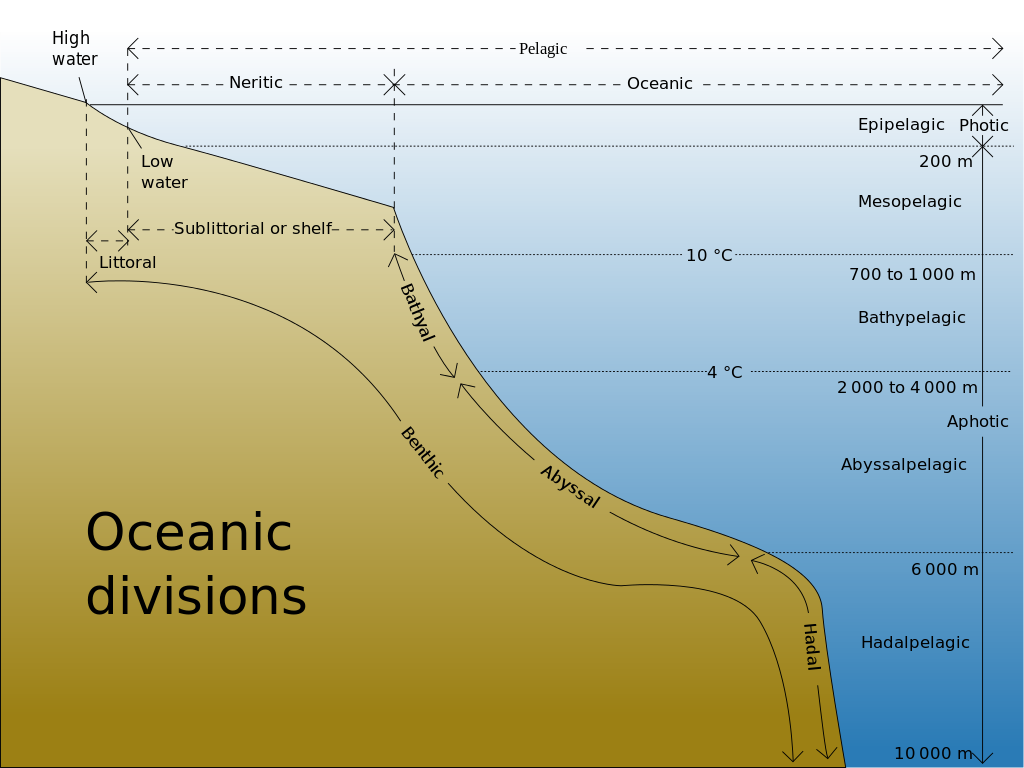
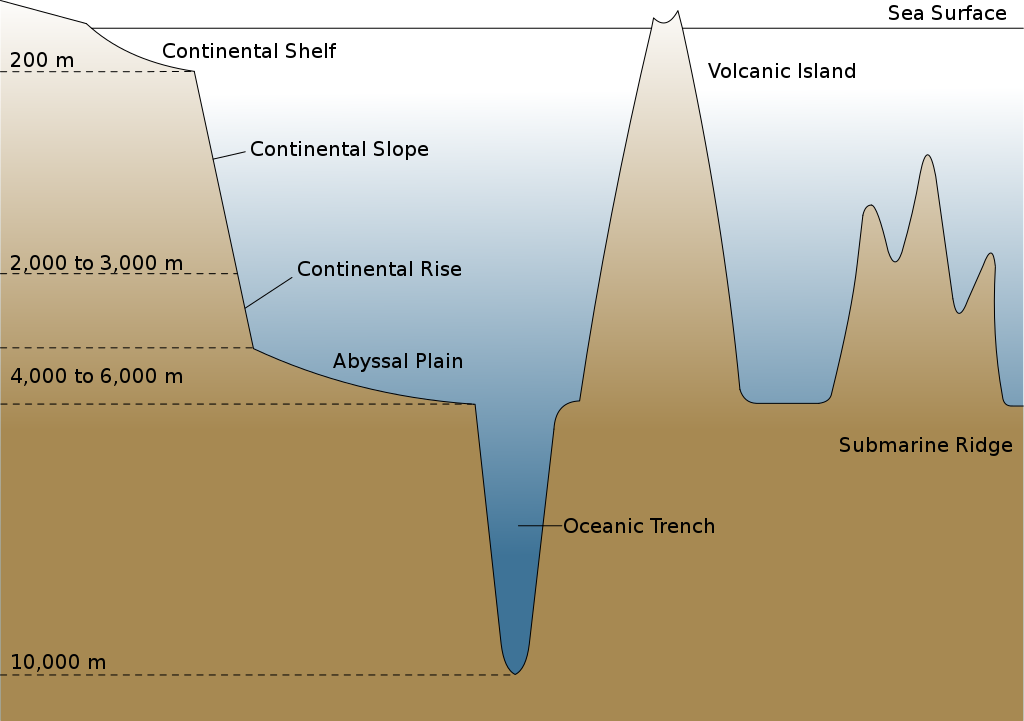
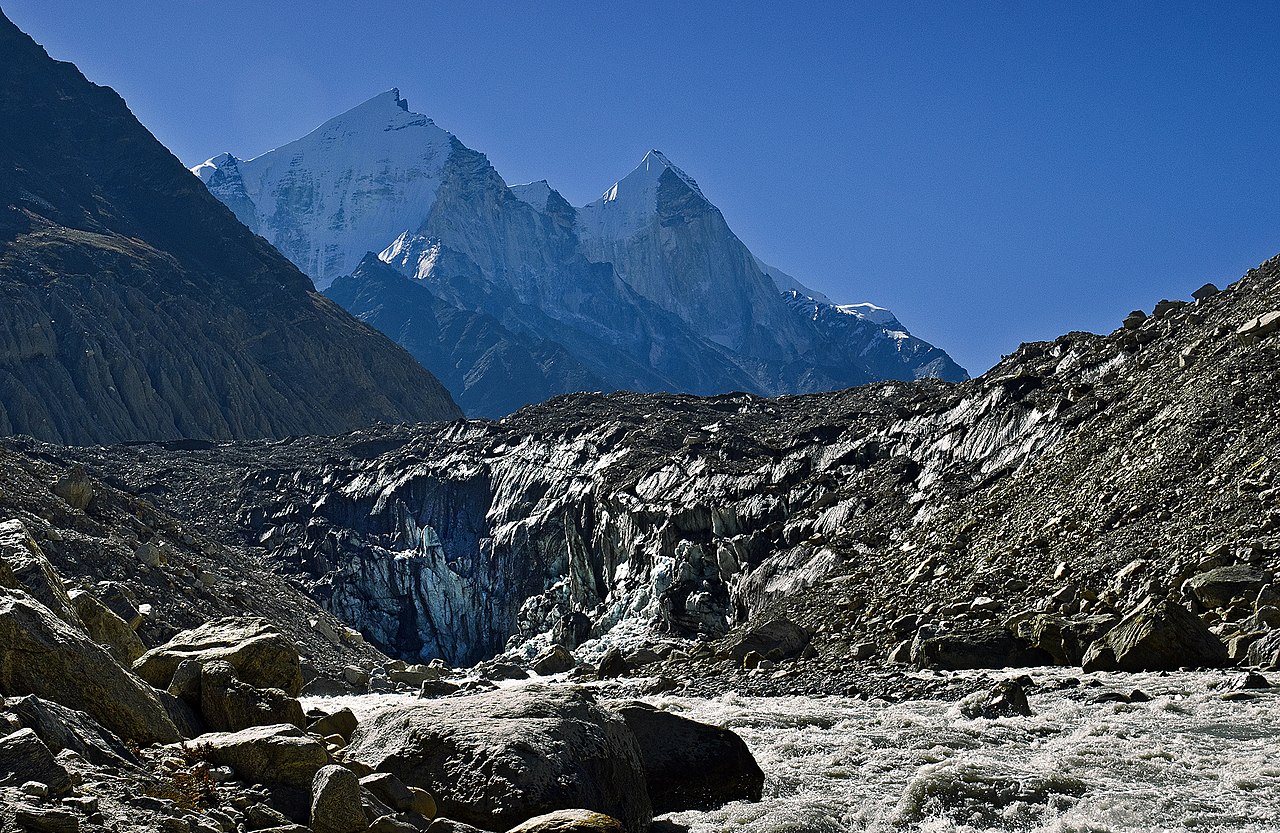
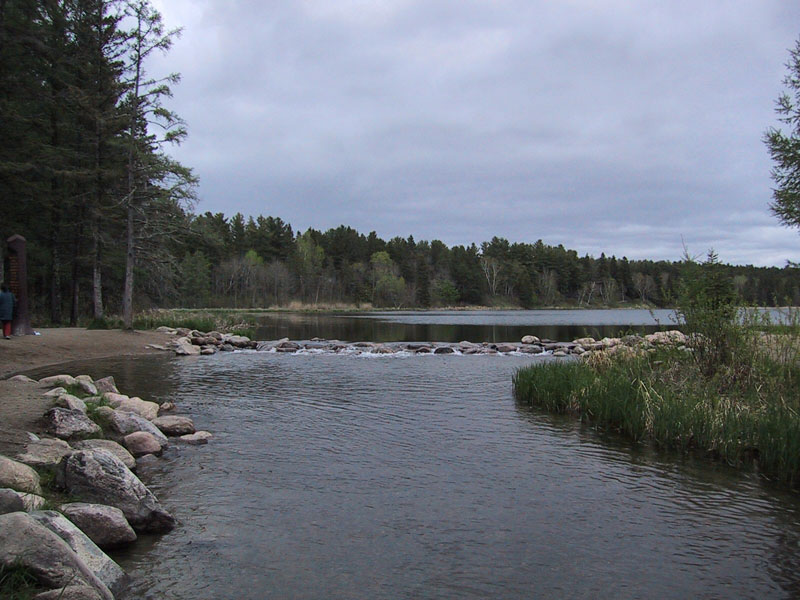
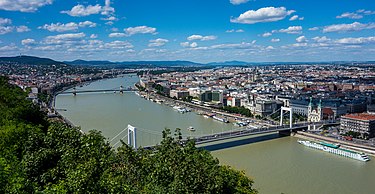
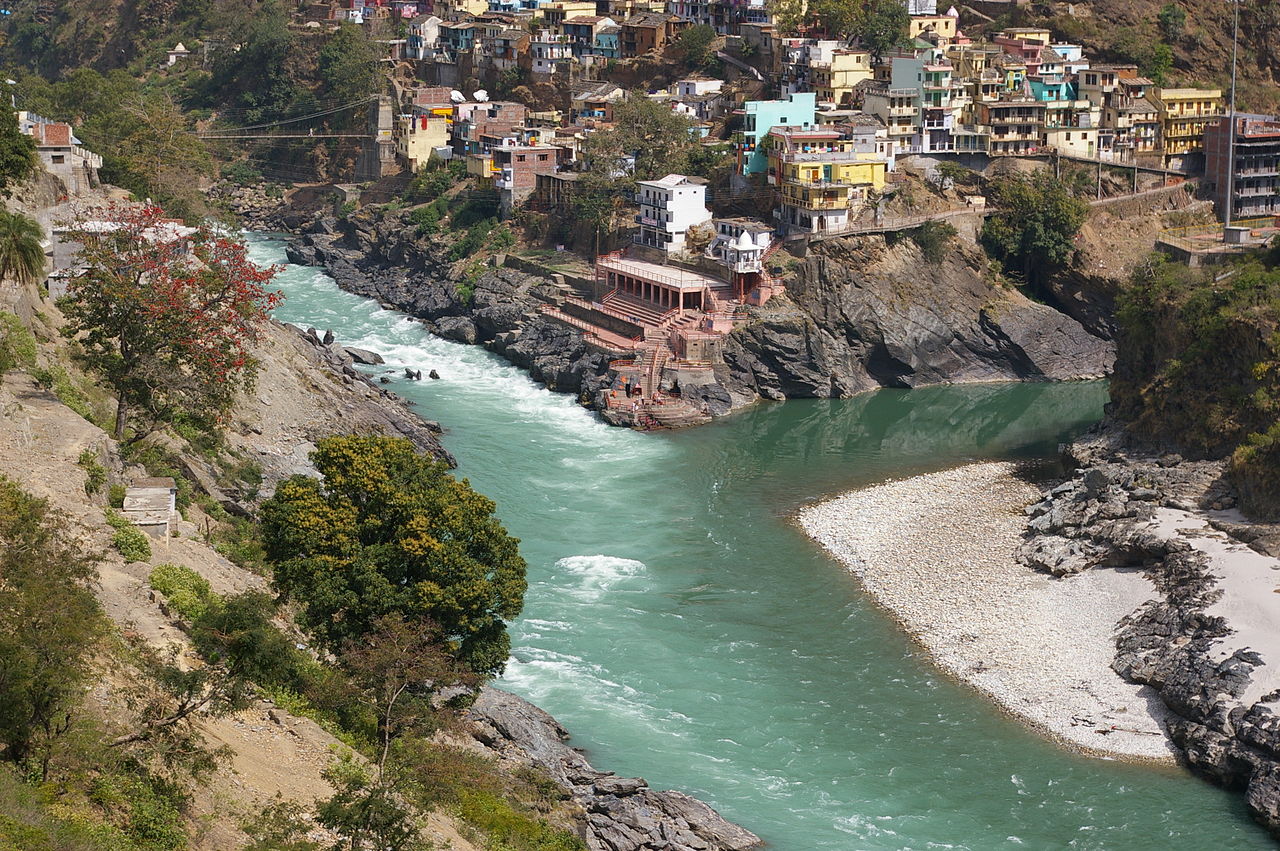
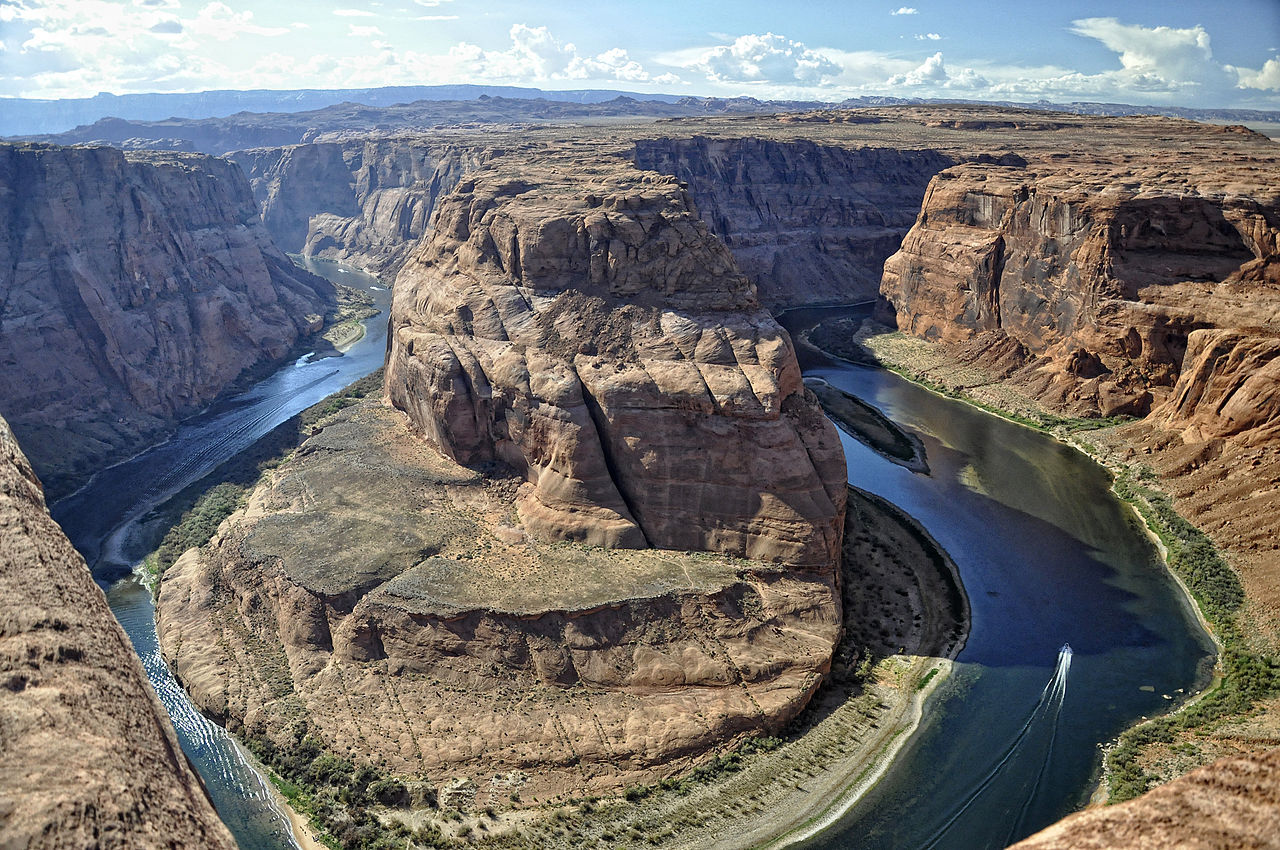
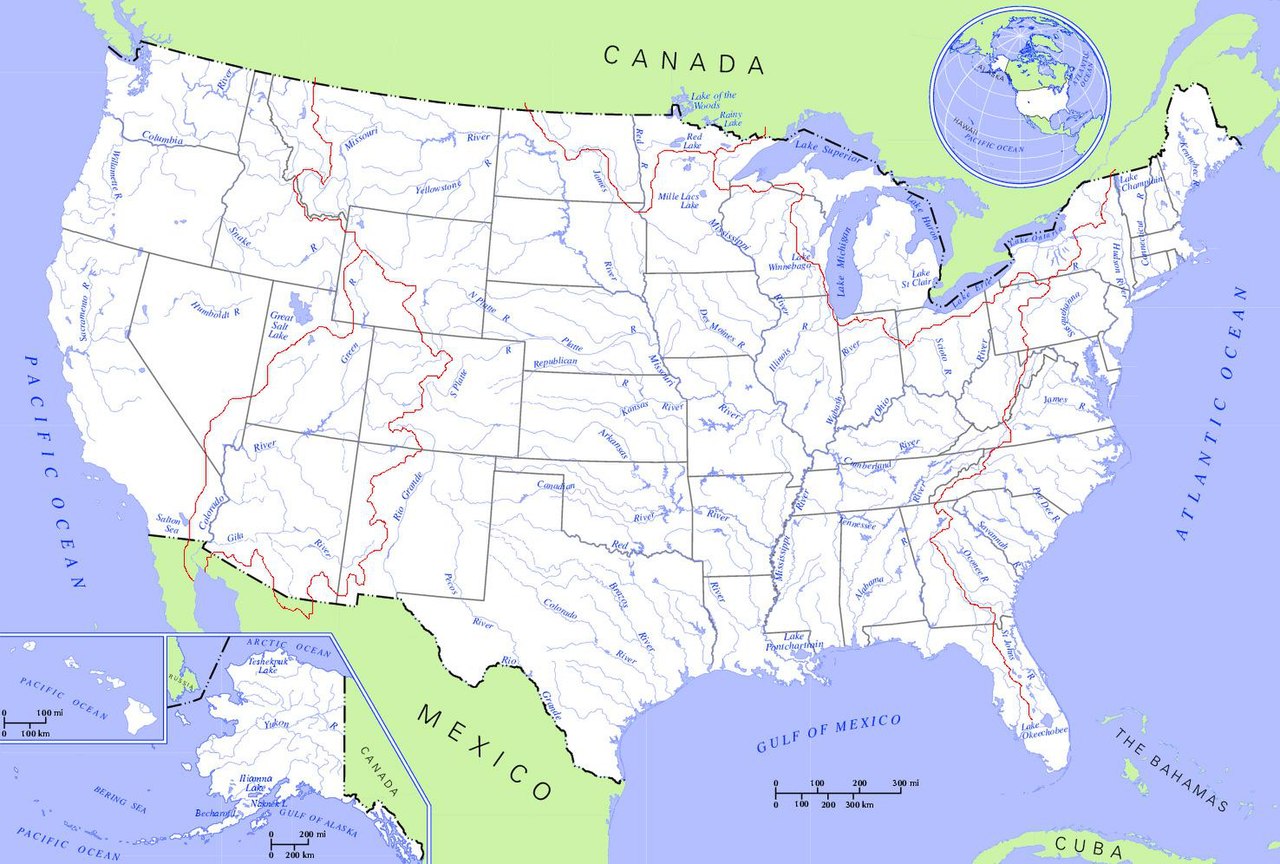
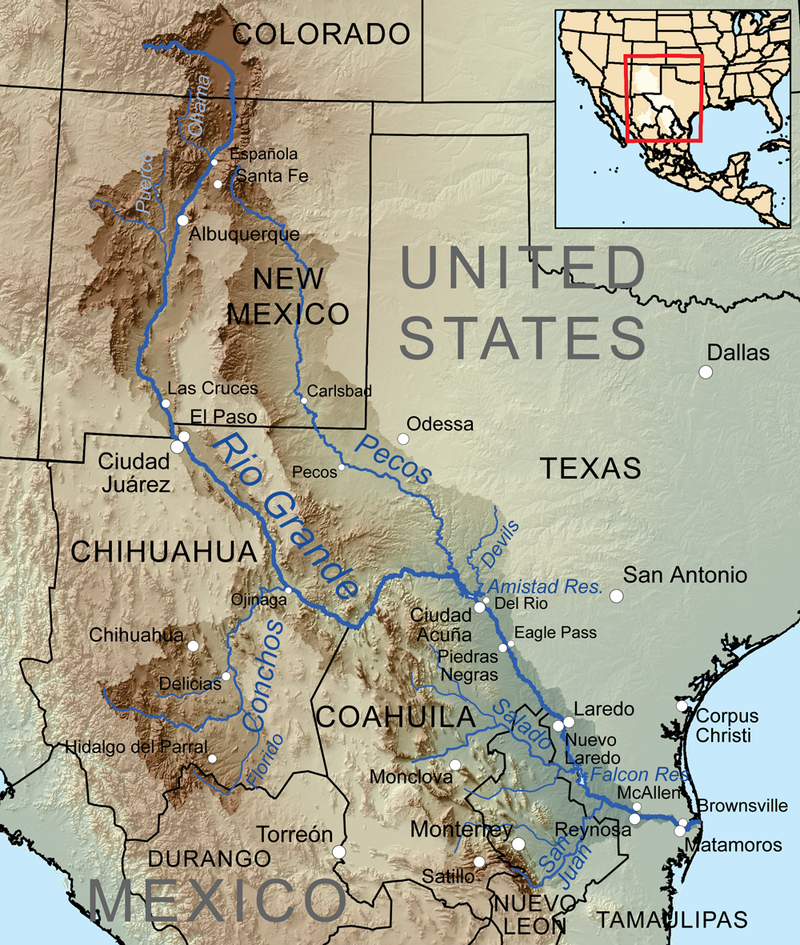
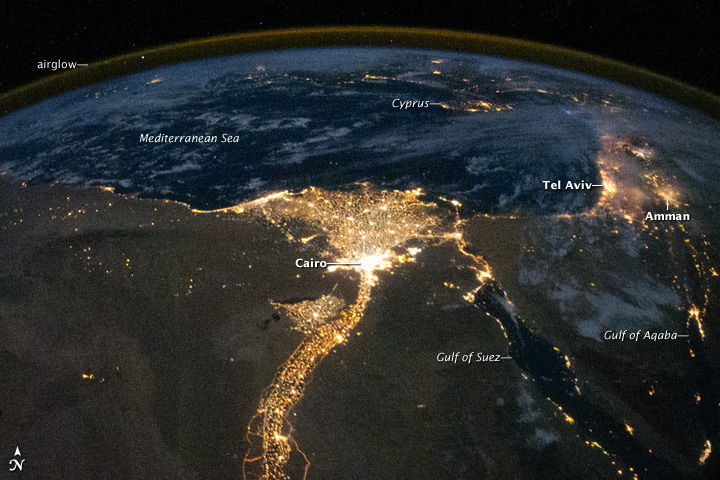
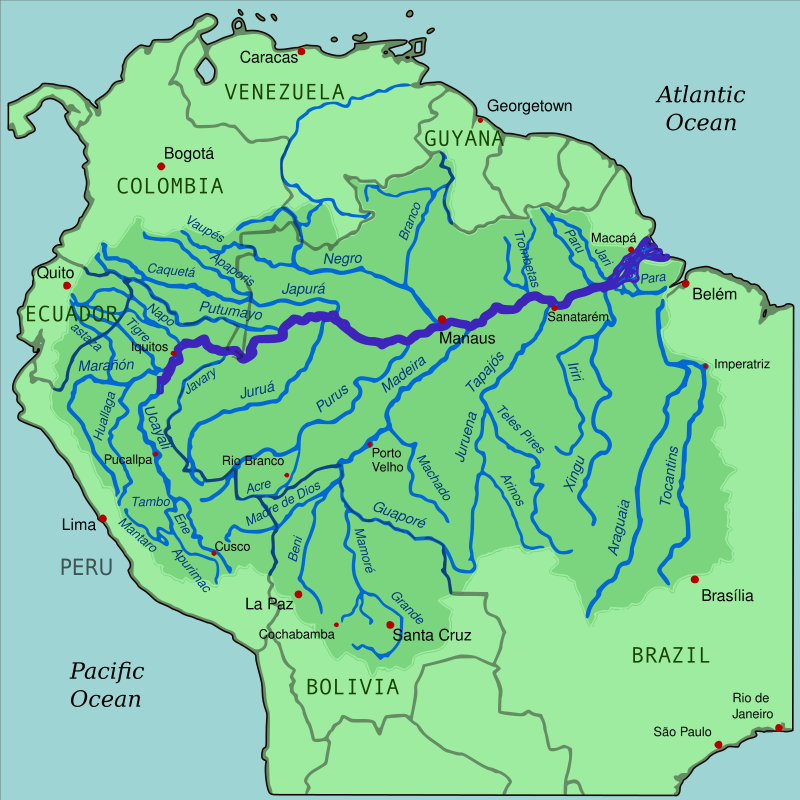
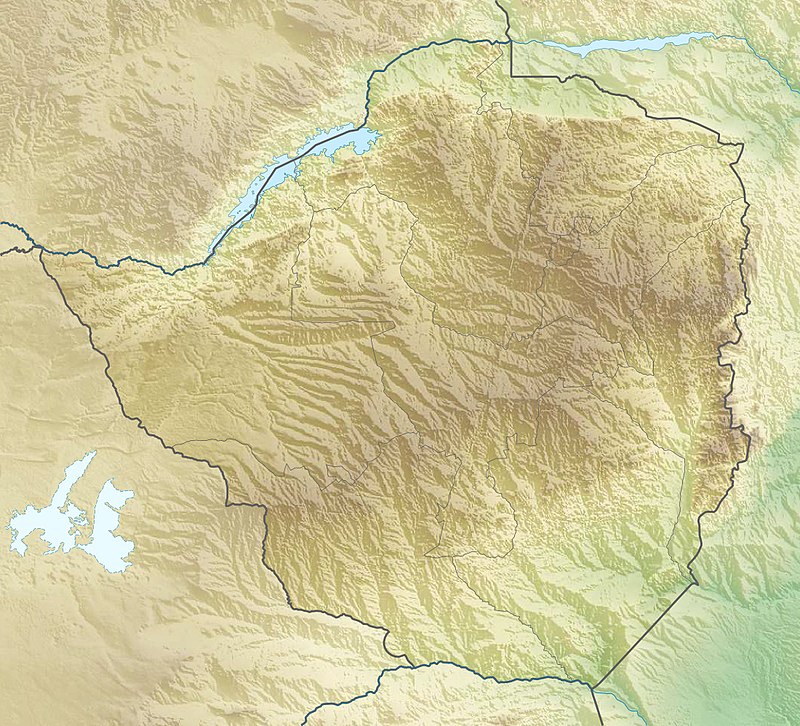
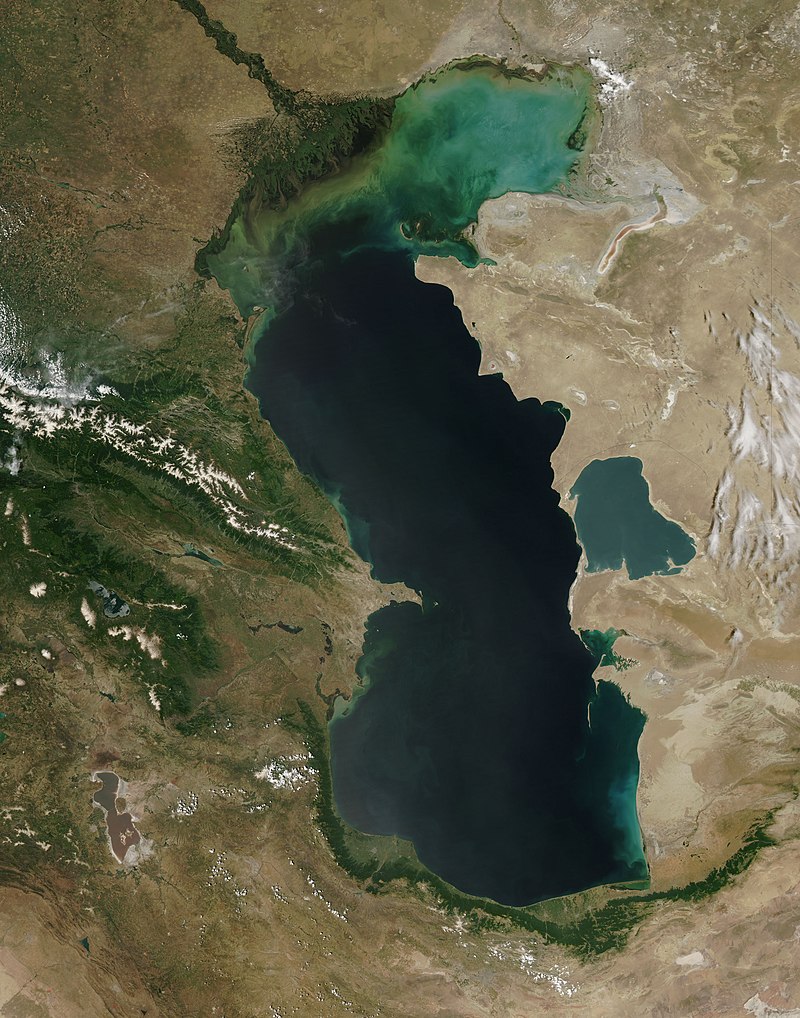
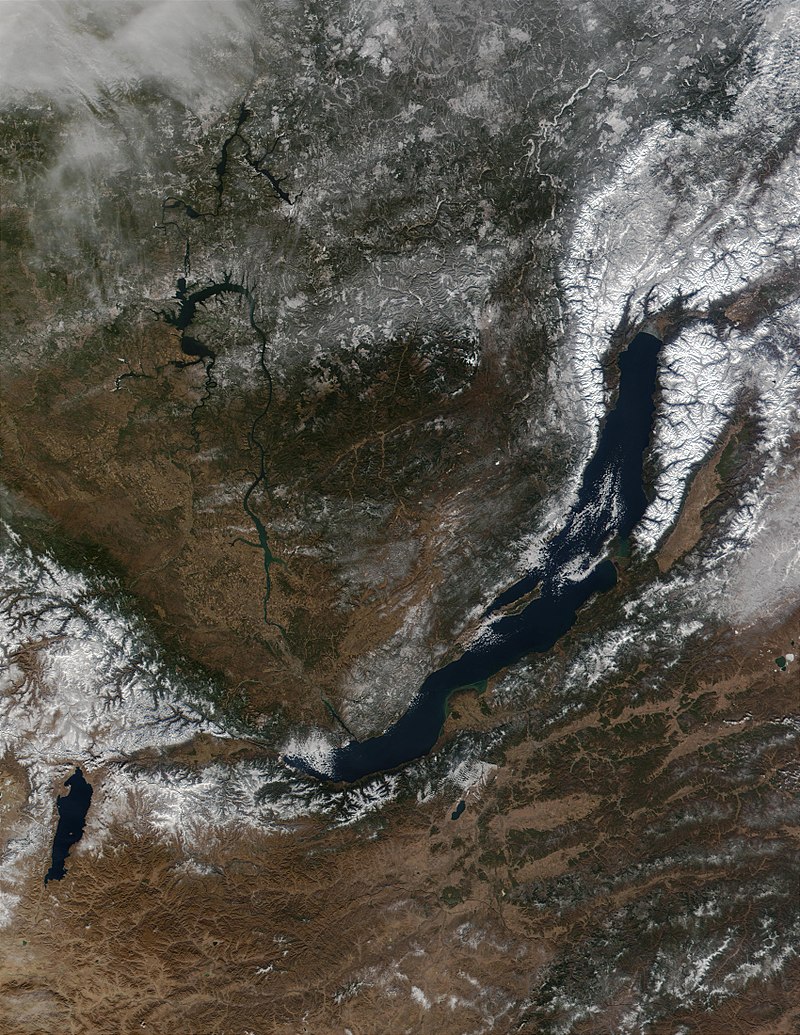
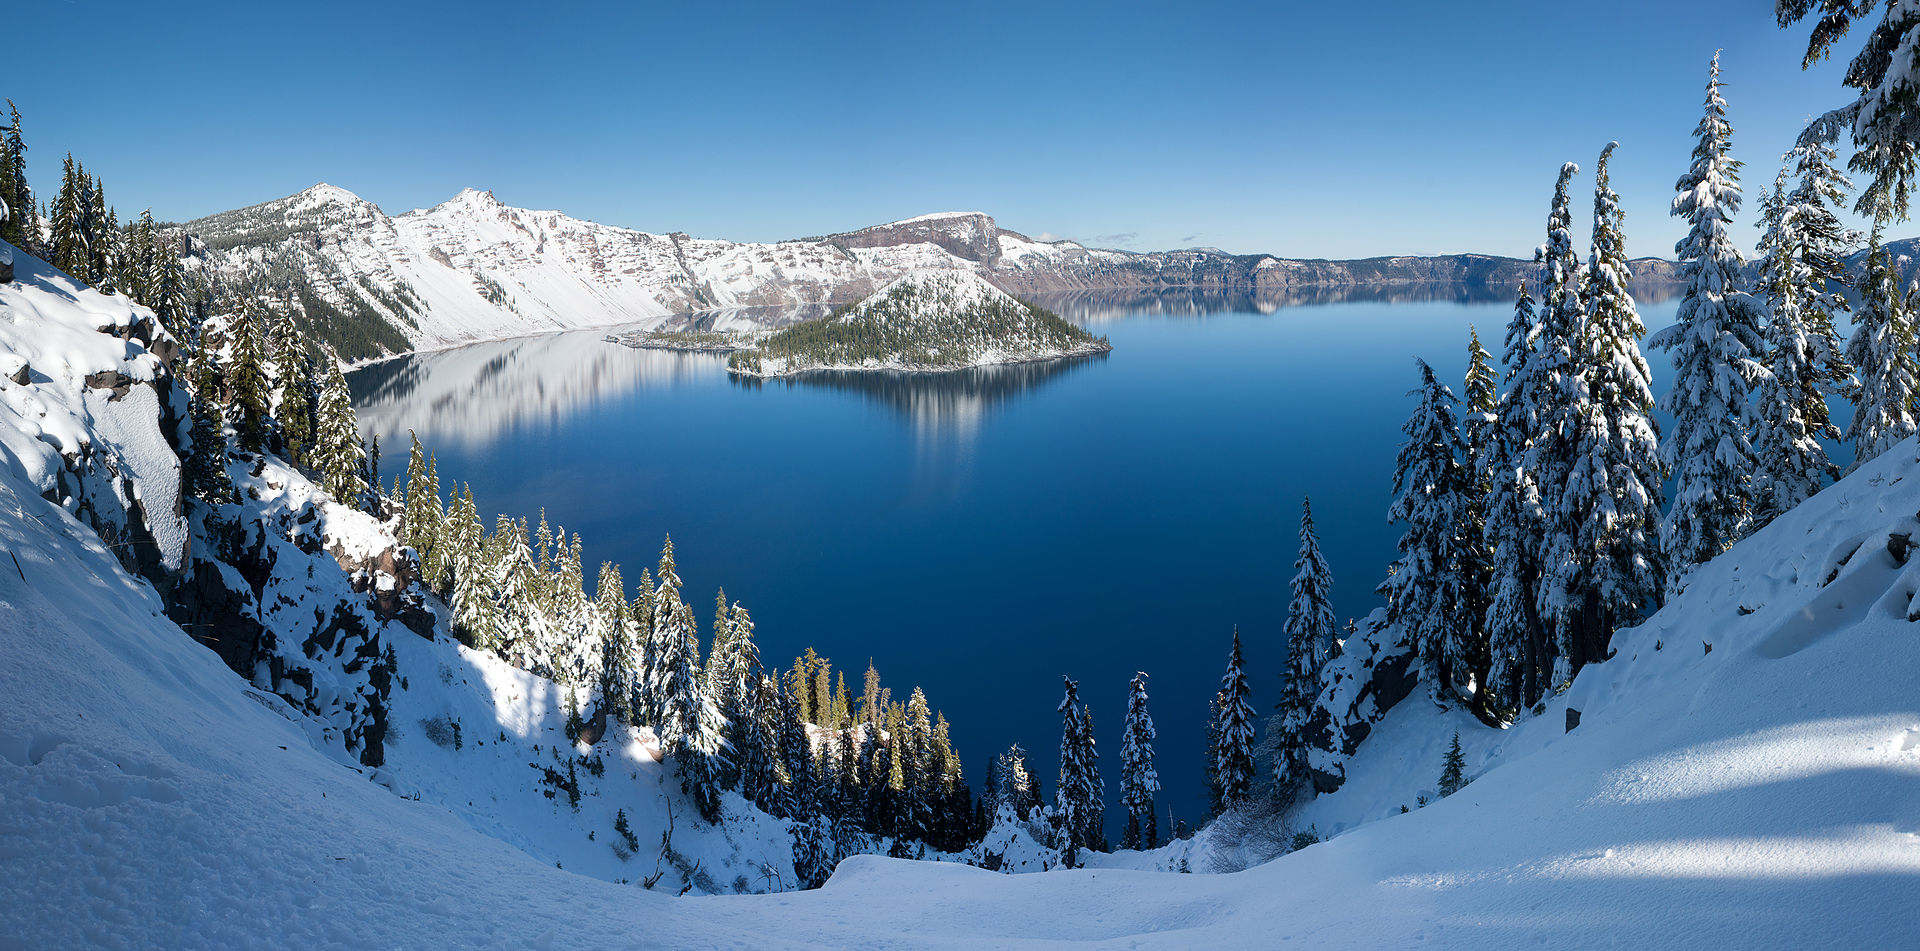
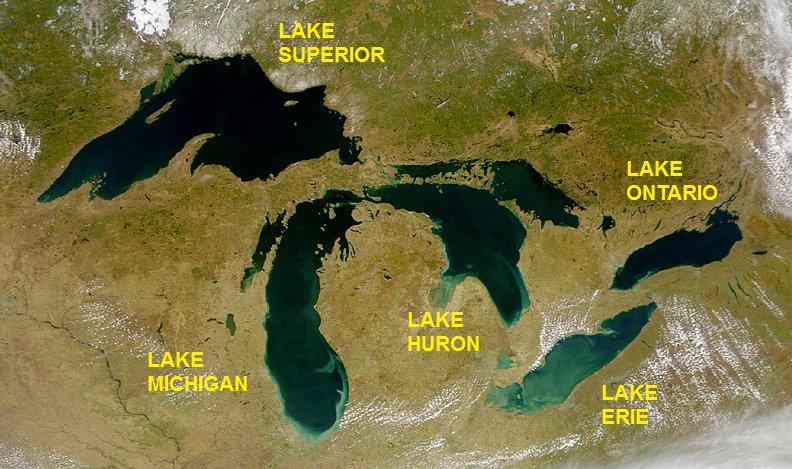
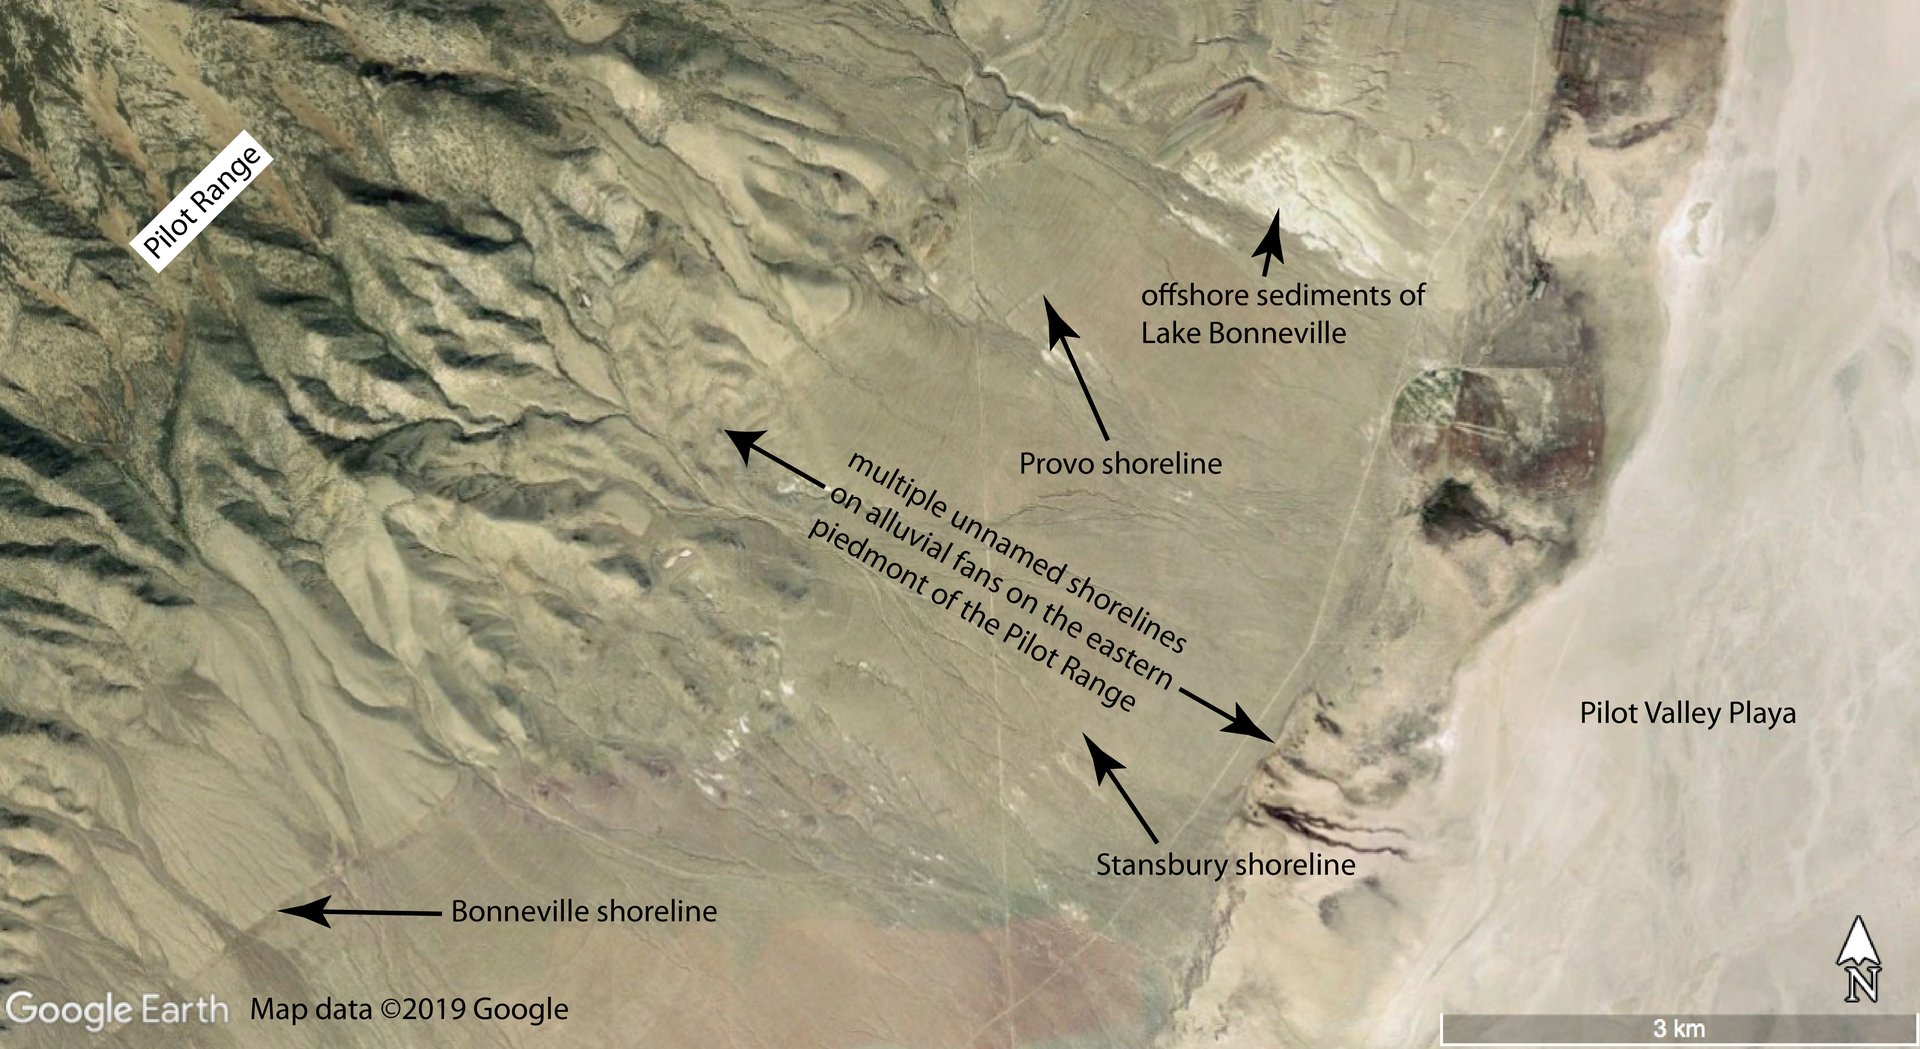
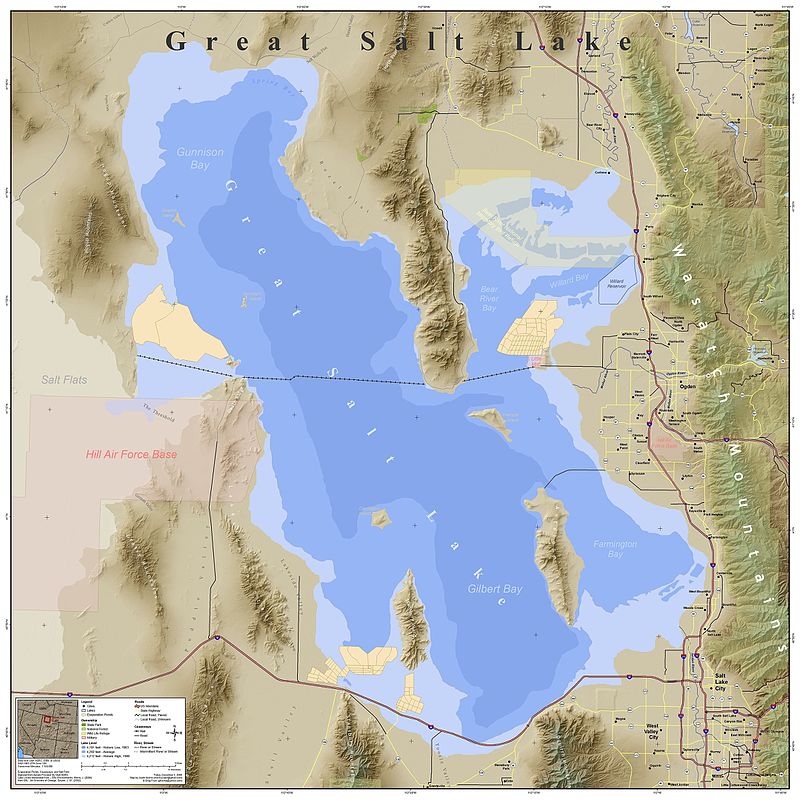
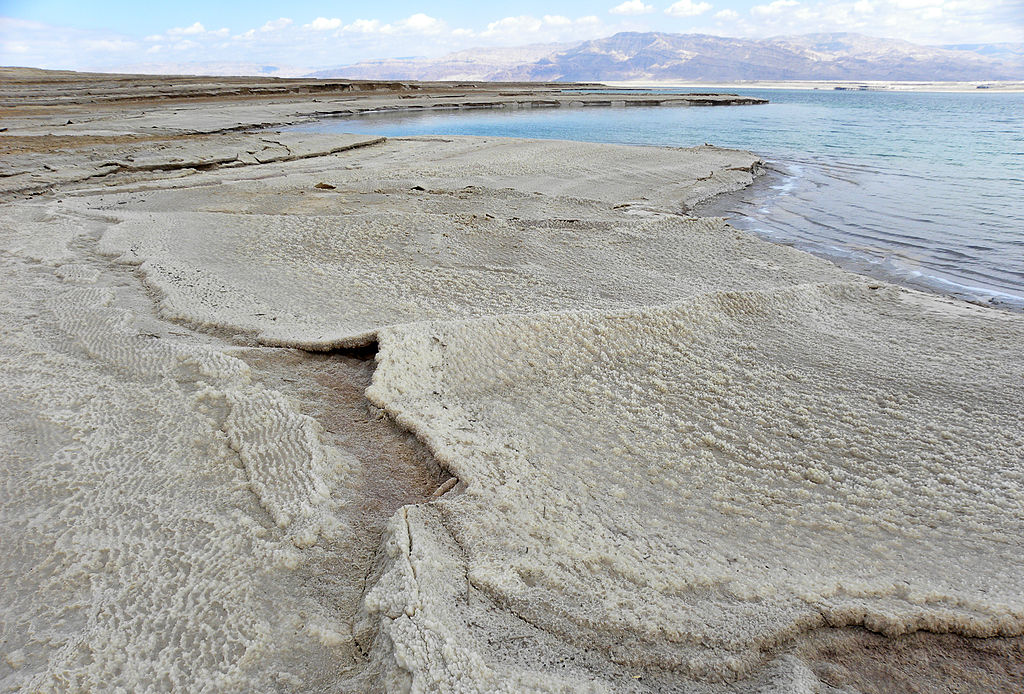
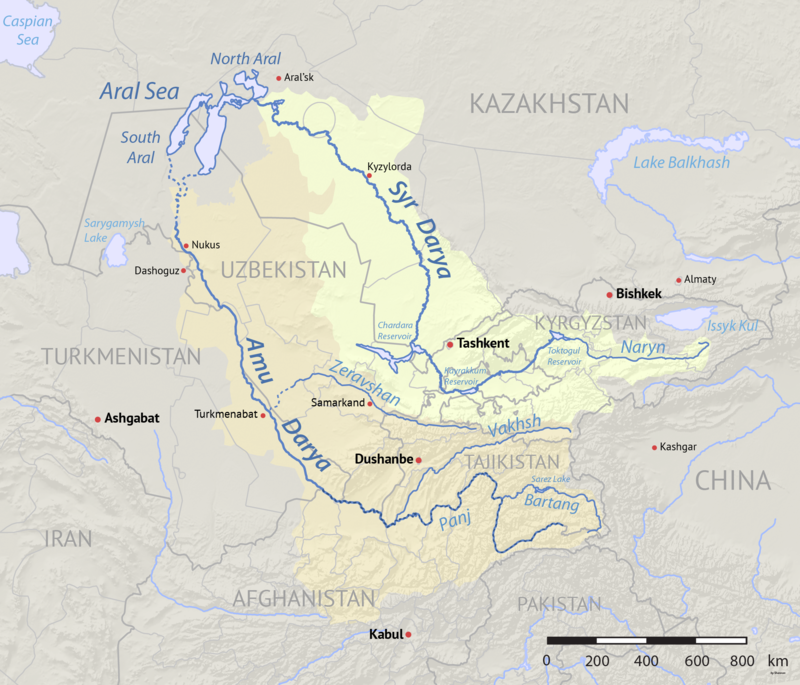
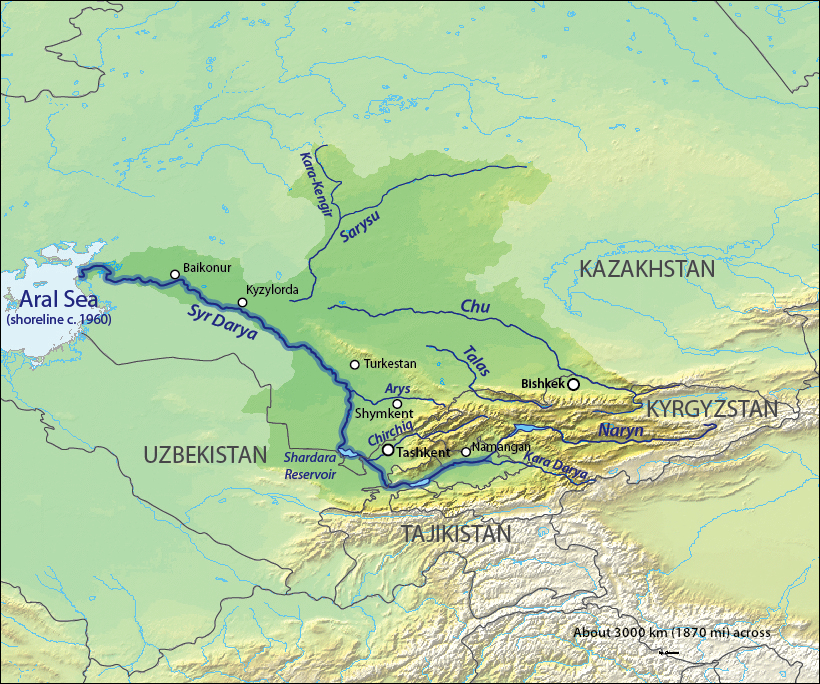
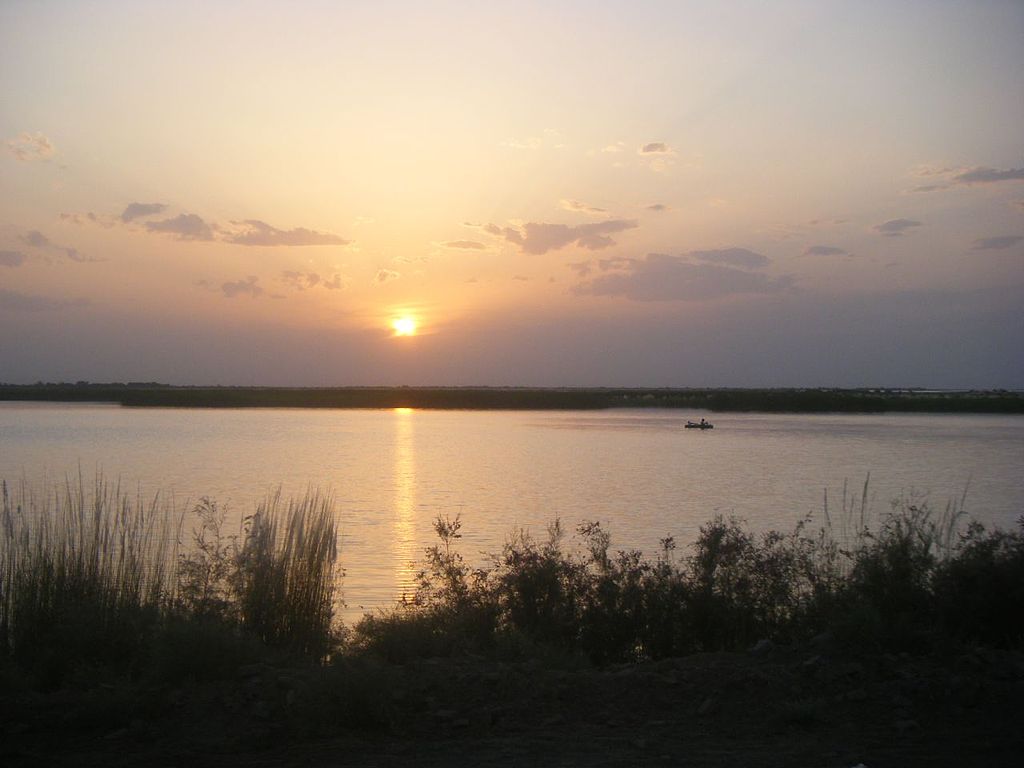
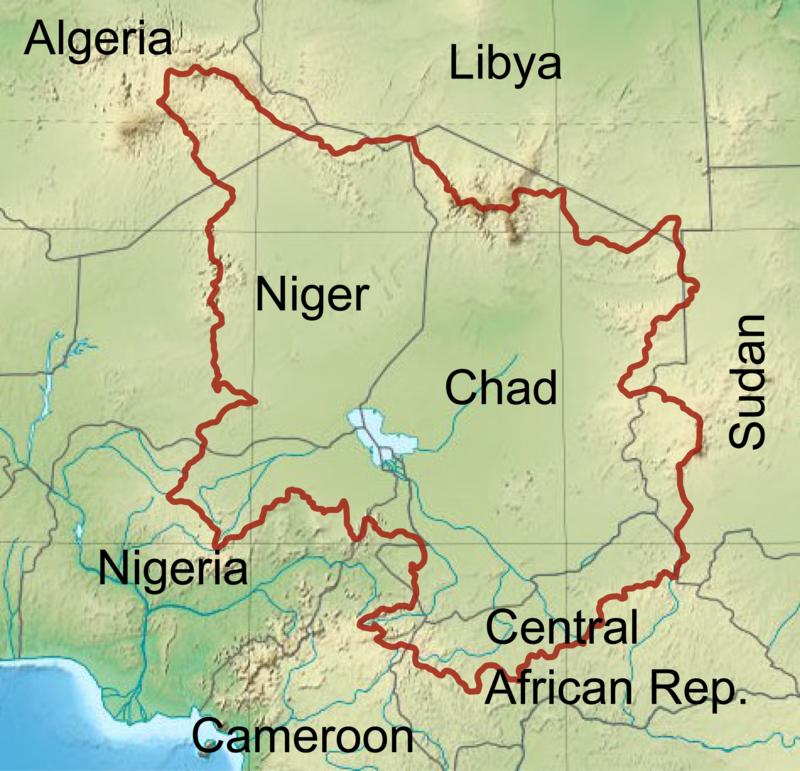
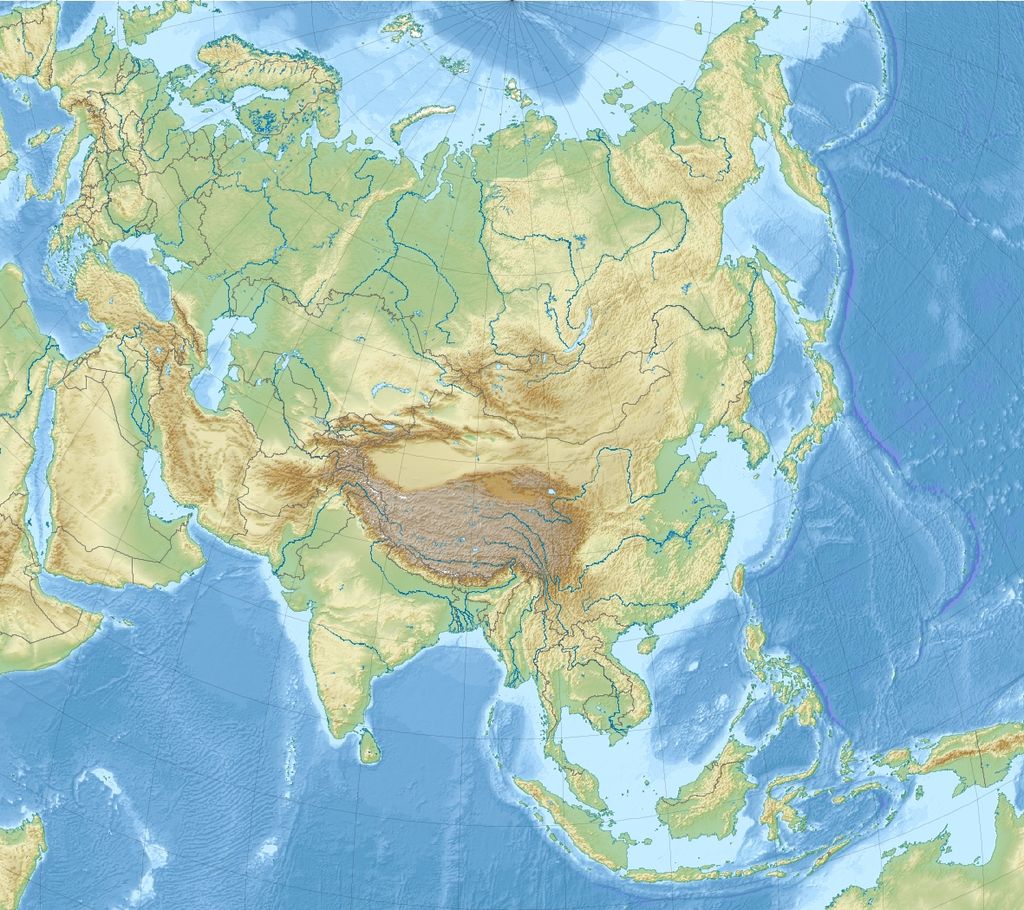
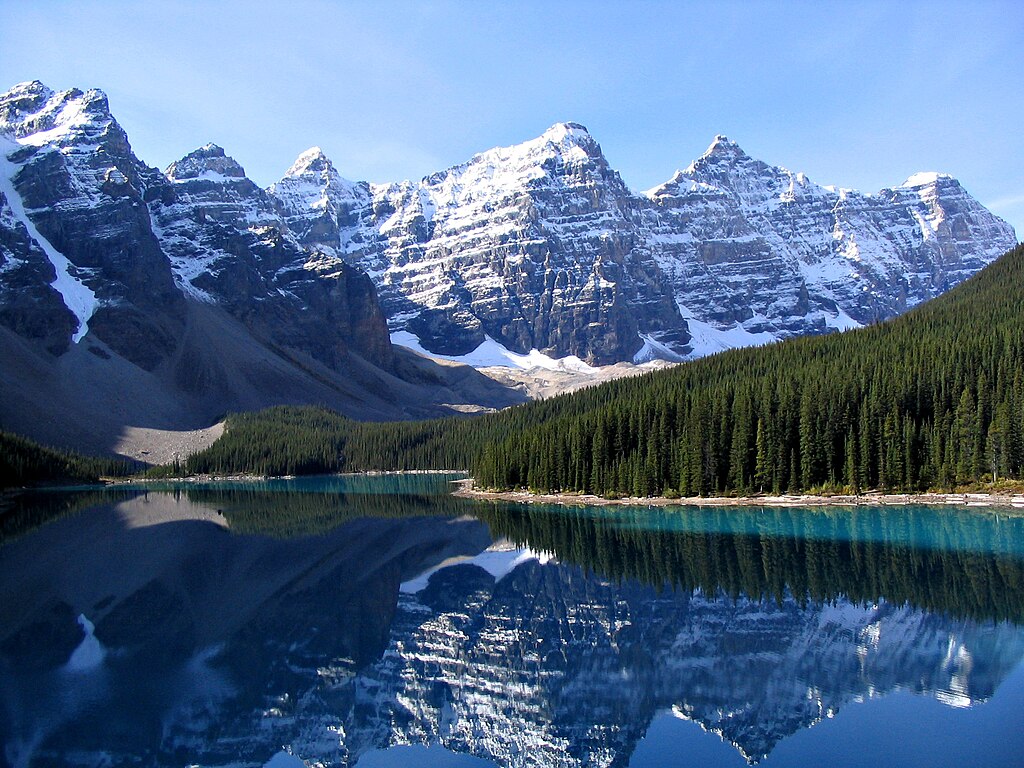
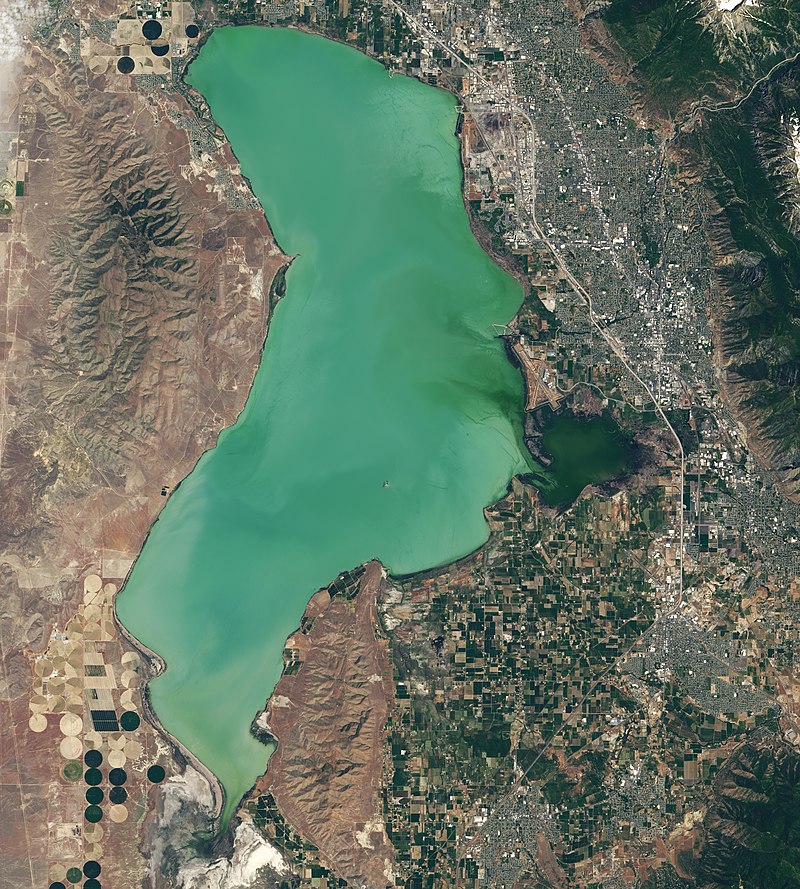
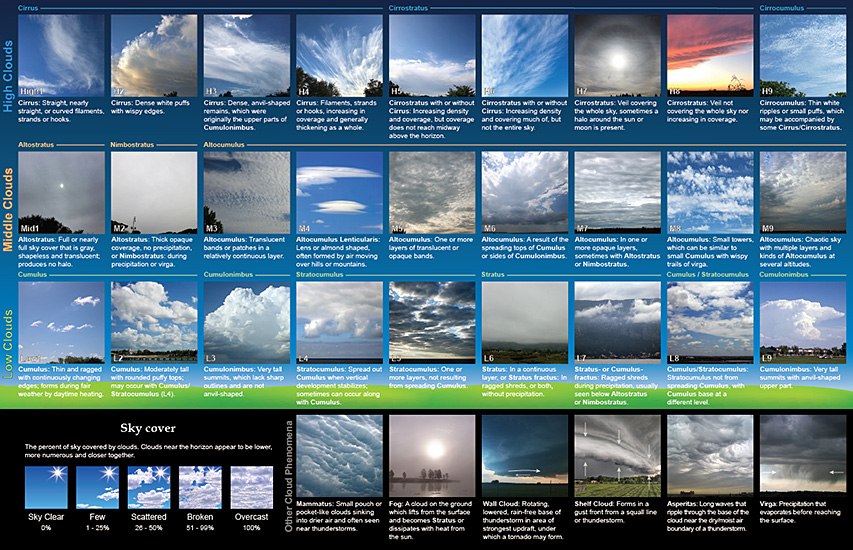
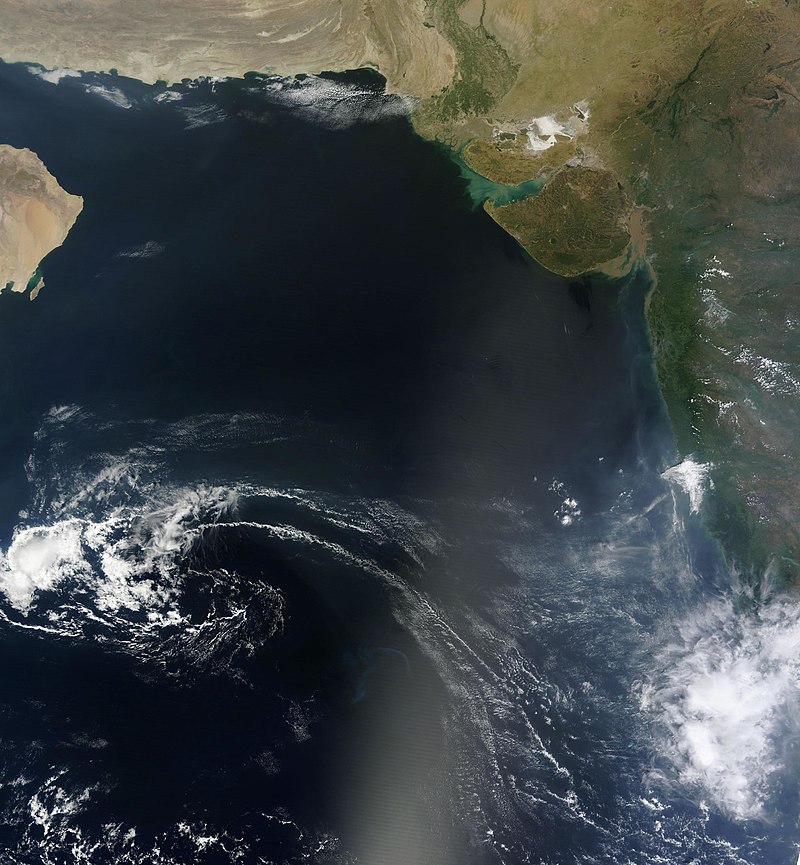
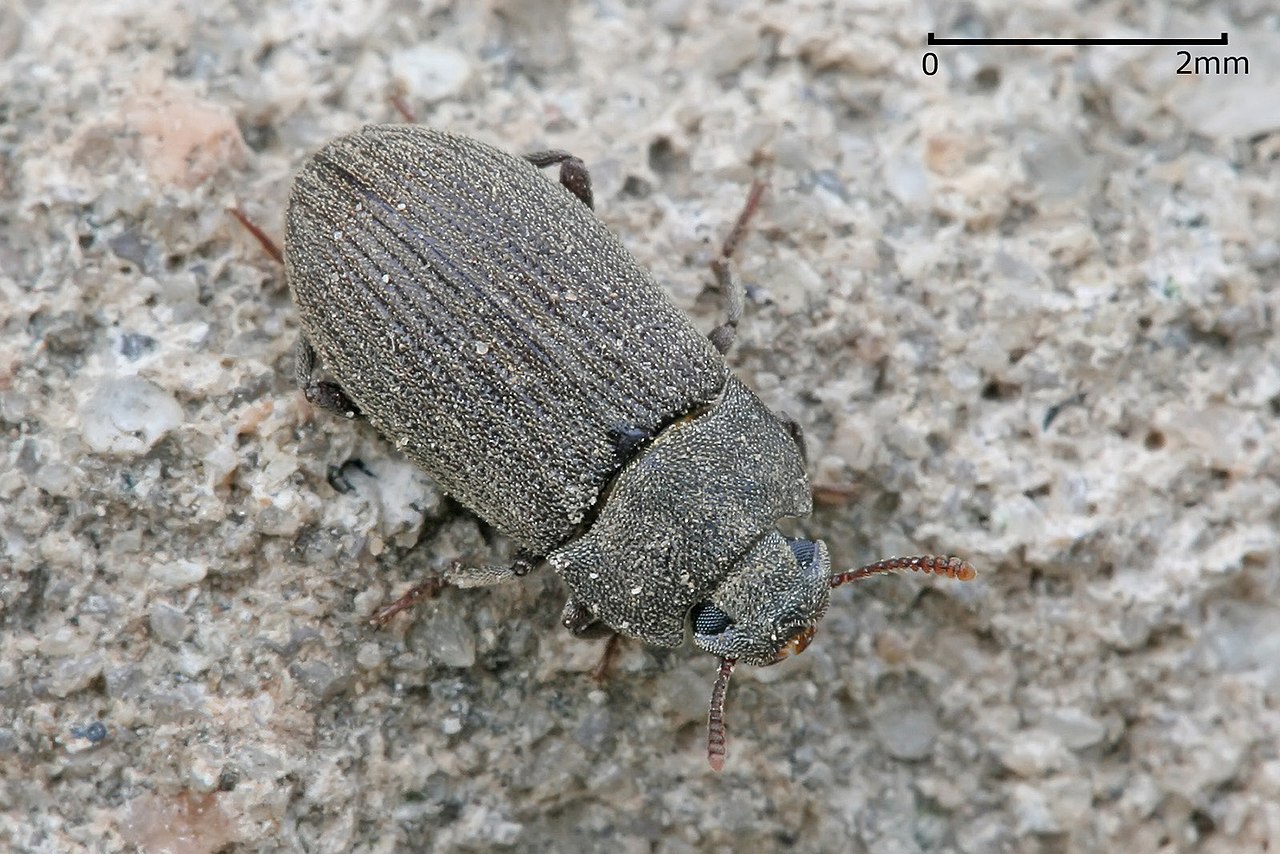 Tenebrionid darkling beetle at Dar es Salaam, Tanzania